rstudio / rstudio/flexdashboard
Interactive leaflet popup not working within flexdashboard
Nobody has claimed this yet.
- Dominant language
- JavaScript
- Stars
- 848
- Forks
- 298
- PR merge metrics
- No merged PRs in 30d
Description
Firstly - thank you all for such a great package.
I am finding that when I create an interactive chart (say with Plotly) and render using MapView - The output presented from the code below works fine (e.g. you are able to click on the point and interact with the chart).
#Create some data
cat <- c(10,20,30,40,50,60)
dog <- c(15,25,35,25,15,25)
lat <- c(33.994229,33.994232,33.994238,33.994242,33.994245,33.994244)
lon <- c(-118.25128,-118.25328,-118.25226,-118.25128,-118.254269,-118.25121)
df = data.frame(cat, dog, lon, lat)


library(sp)
coords <- cbind( df$lon,df$lat)
sp = SpatialPoints(coords)

spdf = SpatialPointsDataFrame(sp, df)
proj4string(spdf) = CRS("+proj=longlat +datum=WGS84 +no_defs +ellps=WGS84 +towgs84=0,0,0")
  #CRS("+init=epsg:3857")

# +ellps=WGS84 +towgs84=0,0,0
#Bind it to a random location

library(mapview)
library(ggplot2)
library(plotly)

mapview(spdf)

#### Create a chart to insert into popup usinf plotly and ggplot
r <- unique(spdf$lat)
MyFunction <- function(x){
  dfs <- spdf[spdf$SampleLocation == x,]
  gr <- ggplot(data = as.data.frame(spdf), aes(x=cat, y=dog)) +
    geom_point() +
    theme_minimal()
  gr<-ggplotly(gr)
  }

Results <- lapply(r, MyFunction)

#distint_spdf <- as.data.frame(spdf) %>% select(SampleLocation,Latitude,Longitude) %>% distinct()

mapview(spdf,
        zcol = "dog",
        popup = popupGraph(Results, width = 600, height = 400, type = "html"))
However when I use this same code chunk in a flexdashboard setting, the popup renders as an black box:
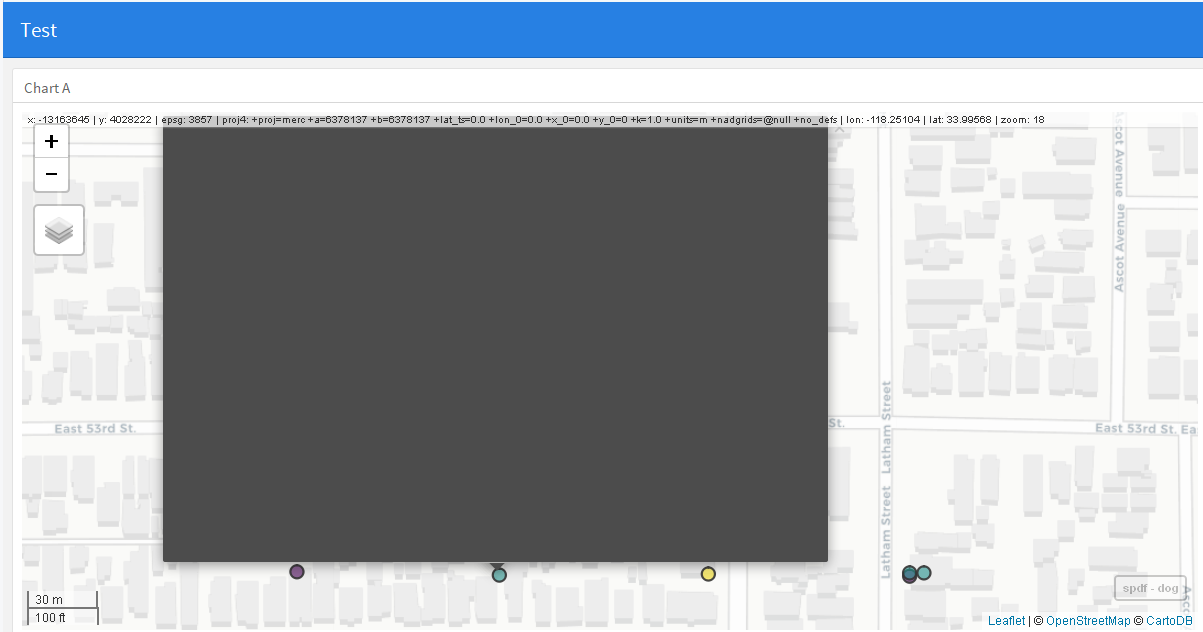
See gist with full code:
https://gist.github.com/Myles12345/a52c8f21a10eb6965aac15f6d53685aa
This seems like this 'might' be an issue with how flexdashboard is handling the Leaflet popup and the fact that interactive content within - is not supported in a flexdashboard setting?
Any help / thoughts / ideas would be most appreciated
Contributor guide
First steps
- Read the whole issue, then the project's contributing guide.
- Comment on the issue to say you are picking it up — it saves two people doing the same work.
- Fork the repository and make your change on a branch.
- Open a pull request that references the issue number.
Research direction
Reproduce the example from the linked gist in a flexdashboard and compare it with the standalone mapview output. Inspect how the Leaflet popup and Plotly HTML are embedded in the dashboard; done means the popup renders and remains interactive rather than appearing as a black box.
Written by the indexing model from the issue text.
Assessment
- Tech stack
- javascript, plotly, r
- Domain
- frontend, web-dev
- Issue type
- Bug
- Difficulty
- 4/5
- Estimated time
- 3-5 days
- Activity status
- Stale
- Clarity
- Needs clarification
- Newbie friendliness
- 30/100