datapipe profiler showing too much information
Nobody has claimed this yet.
- Dominant language
- C++
- Stars
- 992
- Forks
- 270
- Avg merge
- 2d 11h
- Merged PRs (30d)
- 12
Description
The long spikes are datapipes calls when a datapipe gets constructed and they're too deep to be helpful

A closeup showing the relative lengths, long rectangle to the left is datapipe stuff and the wide rectangle to the right is model training
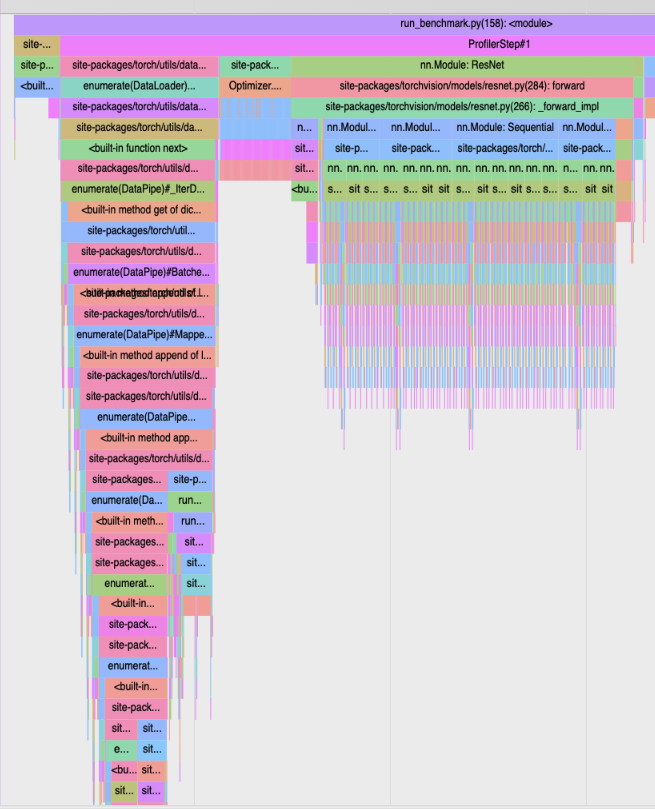
This is not super readable and would be nice to capture the profiles differently
Contributor guide
First steps
- Read the whole issue, then the project's contributing guide.
- Comment on the issue to say you are picking it up — it saves two people doing the same work.
- Fork the repository and make your change on a branch.
- Open a pull request that references the issue number.
Research direction
Begin by reproducing the datapipe construction trace from pytorch/data PR #422 and compare it with the attached screenshots. Trace the profiler path that records or presents those calls; done means datapipe-construction activity is represented more readably without obscuring model-training activity, with a repeatable check for the revised output.
Written by the indexing model from the issue text.
Assessment
- Tech stack
- cpp
- Domain
- observability-sre, performance
- Issue type
- Feature
- Difficulty
- 4/5
- Estimated time
- 3-5 days
- Activity status
- Stale
- Clarity
- Needs clarification
- Newbie friendliness
- 25/100