Plotting with time-zone-aware pd.Timestamp axis not possible
Nobody has claimed this yet.
- Dominant language
- Python
- Stars
- 4.2k
- Forks
- 1.4k
- Avg merge
- 2d 15h
- Merged PRs (30d)
- 14
Description
What is your issue?
When trying to use the plot-method on a DataArray that contains a time axis with time zone aware pandas Timestamps a TypeError is raised.
As a minimal example:
import pandas as pd
import numpy as np
import xarray as xr
time = pd.date_range("2000-02-02 08:00+01:00","2000-02-02 09:00+01:00", 121)
val = np.arange(121)**2
xar = xr.DataArray(val, coords=dict(time=time))
xar.plot()
Results in:
TypeError: Plotting requires coordinates to be numeric, boolean, or dates of type numpy.datetime64, datetime.datetime, cftime.datetime or pandas.Interval. Received data of type object instead.
While matplotlib is capable of handling it. Not in a nice way, but at least without crashing:
import matplotlib.pyplot as plt
plt.figure()
plt.plot(xar.time, xar.values)
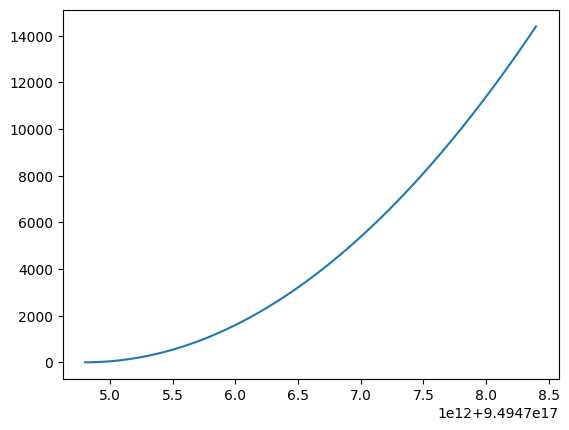
I tried that the same result can be achieved, if in the method issuing the TypeError
https://github.com/pydata/xarray/blob/830ee6de0d545c997df84fe69b0ac2334bde1d1b/xarray/plot/utils.py#L669-L681
also accepts the pandas DatetimeTZDtype as a dtype, i.e. it is added to the tuple numpy_types.
If there are no objections I would issue a PR extending the tuple.
Related observations
_ensure_plottable removal
I found discussions on removing the _ensure_plottable method entirely (#5762, #5763), which was not followed through but would likely also solve this issue.
Pandas
Pandas itself is able to even plot the time stamps in a nice way. So, maybe in the long-term it might make sense to use these capabilities.
xar.to_series().plot()

Contributor guide
First steps
- Read the whole issue, then the project's contributing guide.
- Comment on the issue to say you are picking it up — it saves two people doing the same work.
- Fork the repository and make your change on a branch.
- Open a pull request that references the issue number.
Research direction
Start in xarray/plot/utils.py around lines 669-681, where _ensure_plottable rejects the timezone-aware pandas timestamp coordinate. Reproduce the issue with the minimal DataArray example and inspect the related discussions in #5762 and #5763. Done means plotting the timezone-aware axis no longer raises the reported TypeError.
Written by the indexing model from the issue text.
Assessment
- Tech stack
- matplotlib, numpy, pandas, python
- Domain
- data-visualization
- Issue type
- Bug
- Difficulty
- 3/5
- Estimated time
- 1-2 days
- Activity status
- Stale
- Clarity
- Clearly specified
- Newbie friendliness
- 45/100