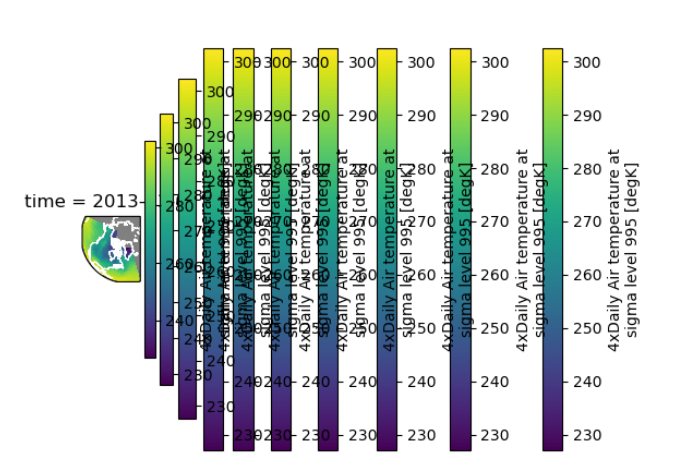
Extra colorbar added for each call of function using plot helper
Nobody has claimed this yet.
- Dominant language
- Python
- Stars
- 4.2k
- Forks
- 1.4k
- Avg merge
- 2d 15h
- Merged PRs (30d)
- 14
Description
What is your issue?
I can't tell right now whether this is a bug or a pitfall (i.e. I'm using xarray wrong) that I've encountered. If the latter, I'd be happy to help out documenting this for future users. I have not been able to reproduce this issue in the xarray Binder template (I don't know why), but was able to create a minimal reproducible example outside of a Jupyter context. Please reproduce from: https://github.com/MattF-NSIDC/sscce-xarray-plot-dup-colorbar
Simply load the page once to see the correct version of the image. Refresh the page, and each time a new colorbar will be added, ad infinitum.
Summary
I'm writing a web application that plots data stored in netcdf files using xarray. I'm using the following documentation to guide my decisions:
https://docs.xarray.dev/en/stable/user-guide/plotting.html#maps
https://matplotlib.org/stable/gallery/user_interfaces/web_application_server_sgskip.html
I'm:
- Plotting example air temp data using xarray's
DataArray.plotmethod - Saving the figure associated with the plot (
plot.figure.savefig) to aBytesIObuffer - Encoding bytes and displaying in an HTML image tag
When I do this, every refresh of the page adds a new colorbar. I don't think steps 2 and 3 are relevant to this issue; I think the important part is that repeated calls to the xarray plot helper are executed within the same Python process.
I can work around this by passing figsize=(width, height) to the plot method.
The xarray docs (linked above) offer a suggestion about why this happens:
If figsize or size are used, a new figure is created, so this is mutually exclusive with the ax argument.
And the matplot lib docs (linked above) offer another suggestion:
pyplot maintains references to the opened figures to make show work, but this will cause memory leaks unless the figures are properly closed
I wonder if this may have something to do with the stateful nature of matplotlib.pyplot?
Thanks for your time!
Matt
Contributor guide
First steps
- Read the whole issue, then the project's contributing guide.
- Comment on the issue to say you are picking it up — it saves two people doing the same work.
- Fork the repository and make your change on a branch.
- Open a pull request that references the issue number.
Research direction
Start by reproducing the behavior in the linked sscce-xarray-plot-dup-colorbar project, especially repeated calls in one Python process. Read xarray's plotting maps documentation alongside Matplotlib's web-application example and investigate the interaction between repeated plot-helper calls and figure state. Done means establishing whether this is an xarray bug or a usage/documentation pitfall and recording the appropriate resolution.
Written by the indexing model from the issue text.
Assessment
- Tech stack
- python
- Domain
- data-visualization
- Issue type
- Bug
- Difficulty
- 4/5
- Estimated time
- 3-5 days
- Activity status
- Stale
- Clarity
- Mostly clear
- Newbie friendliness
- 35/100