Explaining xarray in a single picture
Nobody has claimed this yet.
- Dominant language
- Python
- Stars
- 4.2k
- Forks
- 1.4k
- Avg merge
- 2d 15h
- Merged PRs (30d)
- 14
Description
What is your issue?
Hi folks, I'm working on a mini-tutorial introducing xarray for some folks in our genetics community and noticed something slightly confusing about the typical pictures used to help describe what xarray is for.
E.g., this picture is commonly used:
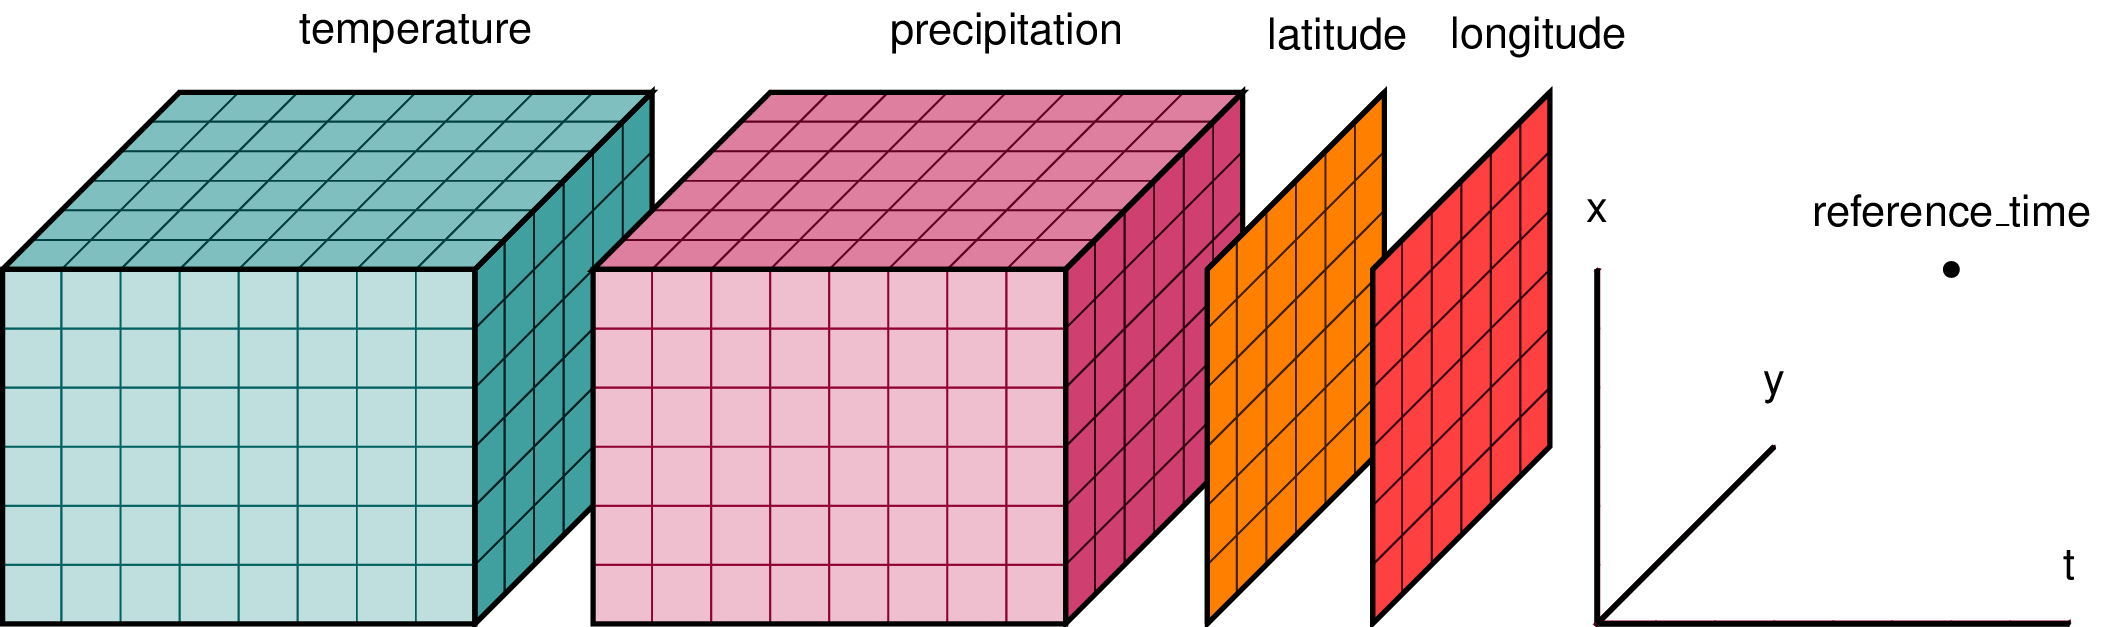
I get that temperature and precipitation are data variables which have been measured over the three dimensions of latitude, longitude and time. But I'm slightly confused here because I would've thought that latitude and longitude would be 1-dimensional coordinate variables, yet they are drawn as 2-D arrays?
Elsewhere I found a slightly different version:
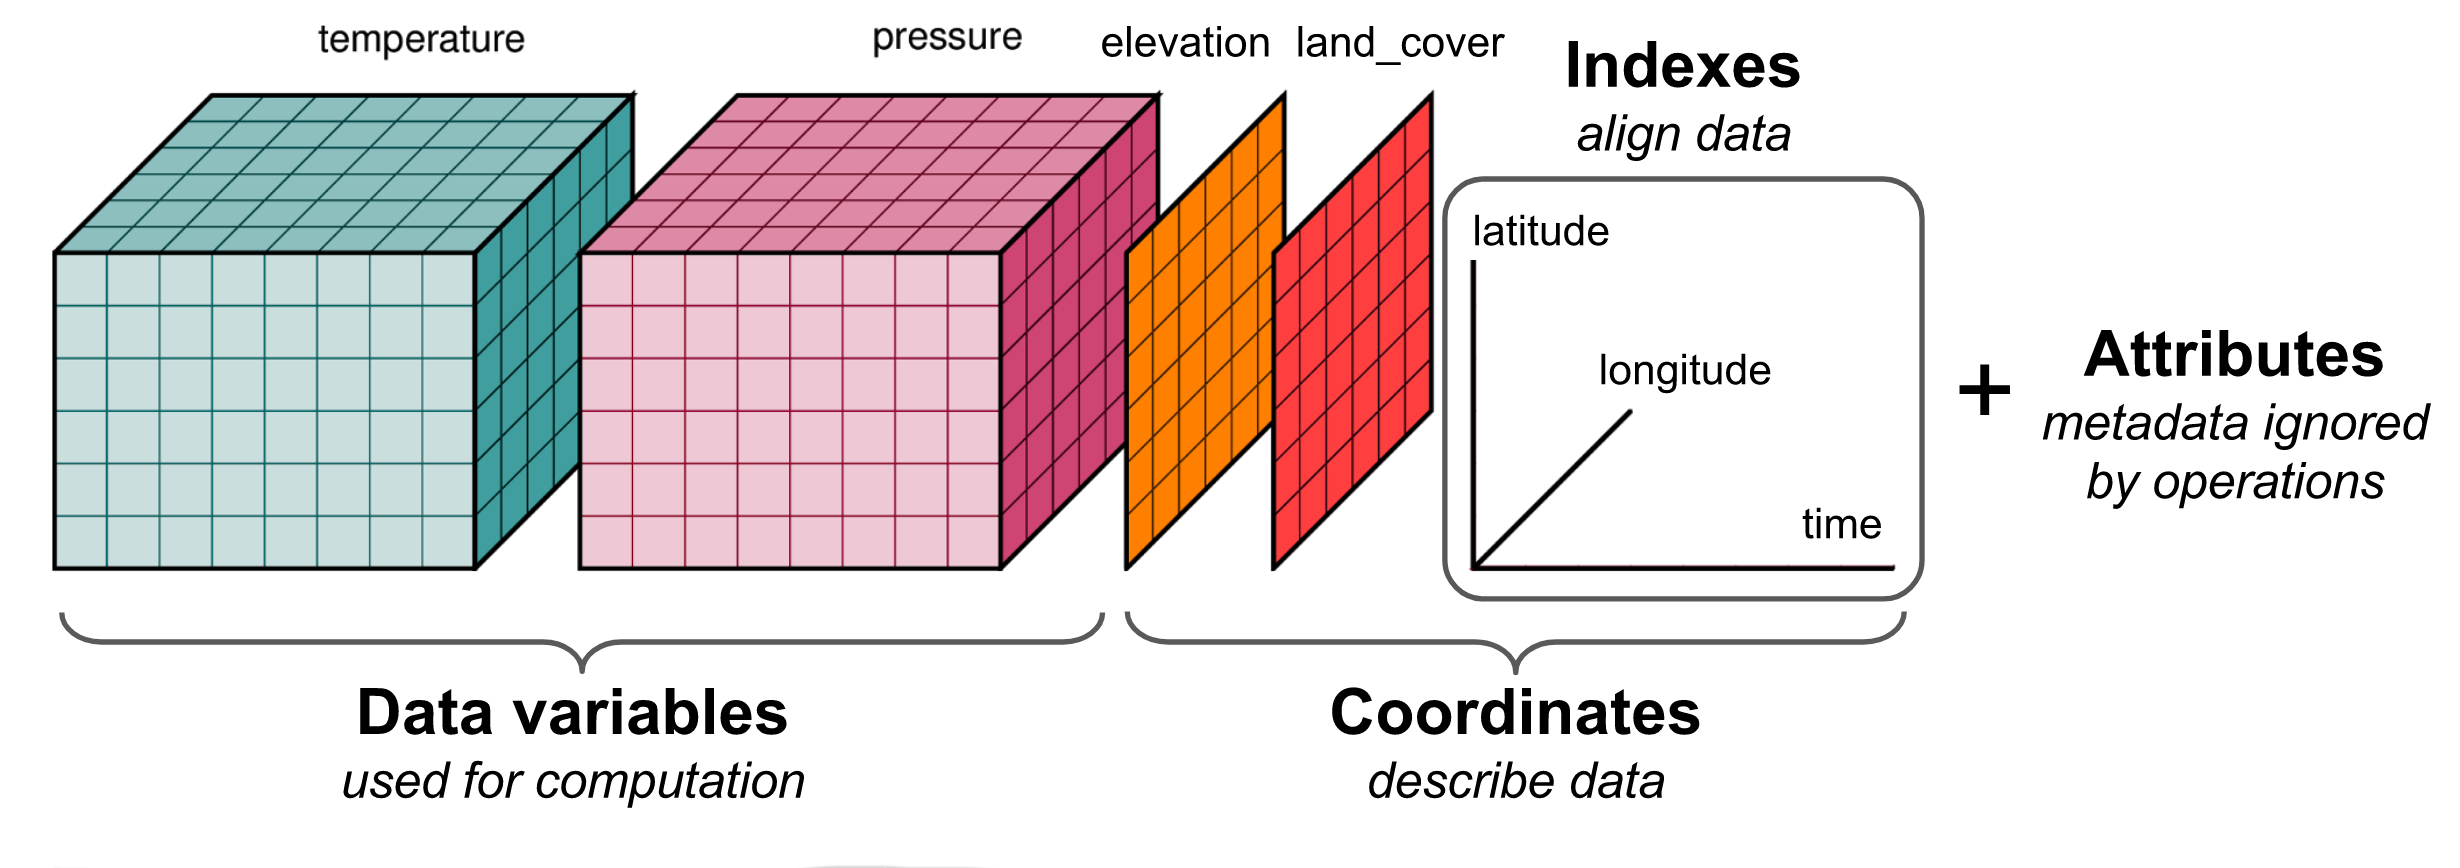
This makes more sense to me, because here the 2-D arrays have been labeled as "elevation" and "land_cover", and thus these are variables which are measured over the dimensions of latitude and longitude but not time, hence 2-D. Also, here latitude, longitude and time are shown labelling the dimensions, which again makes a bit more sense. However, "elevantion" and "land_cover" are included within the "coordinates" bracket, and I would have thought that elevation and land_cover would be more naturally considered as data variables?
Feel free to close/ignore/set me straight if I'm missing something here, but just thought I would raise to say that I was looking for a simple picture to help me explain what xarray is all about for newcomers and found these existing pictures a little confusing.
Contributor guide
First steps
- Read the whole issue, then the project's contributing guide.
- Comment on the issue to say you are picking it up — it saves two people doing the same work.
- Fork the repository and make your change on a branch.
- Open a pull request that references the issue number.
Research direction
Start by comparing the two linked xarray diagrams and the issue's discussion of dimensions, coordinate variables, and data variables. Done means a newcomer-facing single picture that consistently distinguishes these concepts and resolves the latitude/longitude and elevation/land_cover confusion.
Written by the indexing model from the issue text.
Assessment
- Tech stack
- python
- Domain
- documentation
- Issue type
- Documentation
- Difficulty
- 5/5
- Estimated time
- Over a week
- Activity status
- Stale
- Clarity
- Needs clarification
- Newbie friendliness
- 30/100