prometheus / prometheus/node_exporter
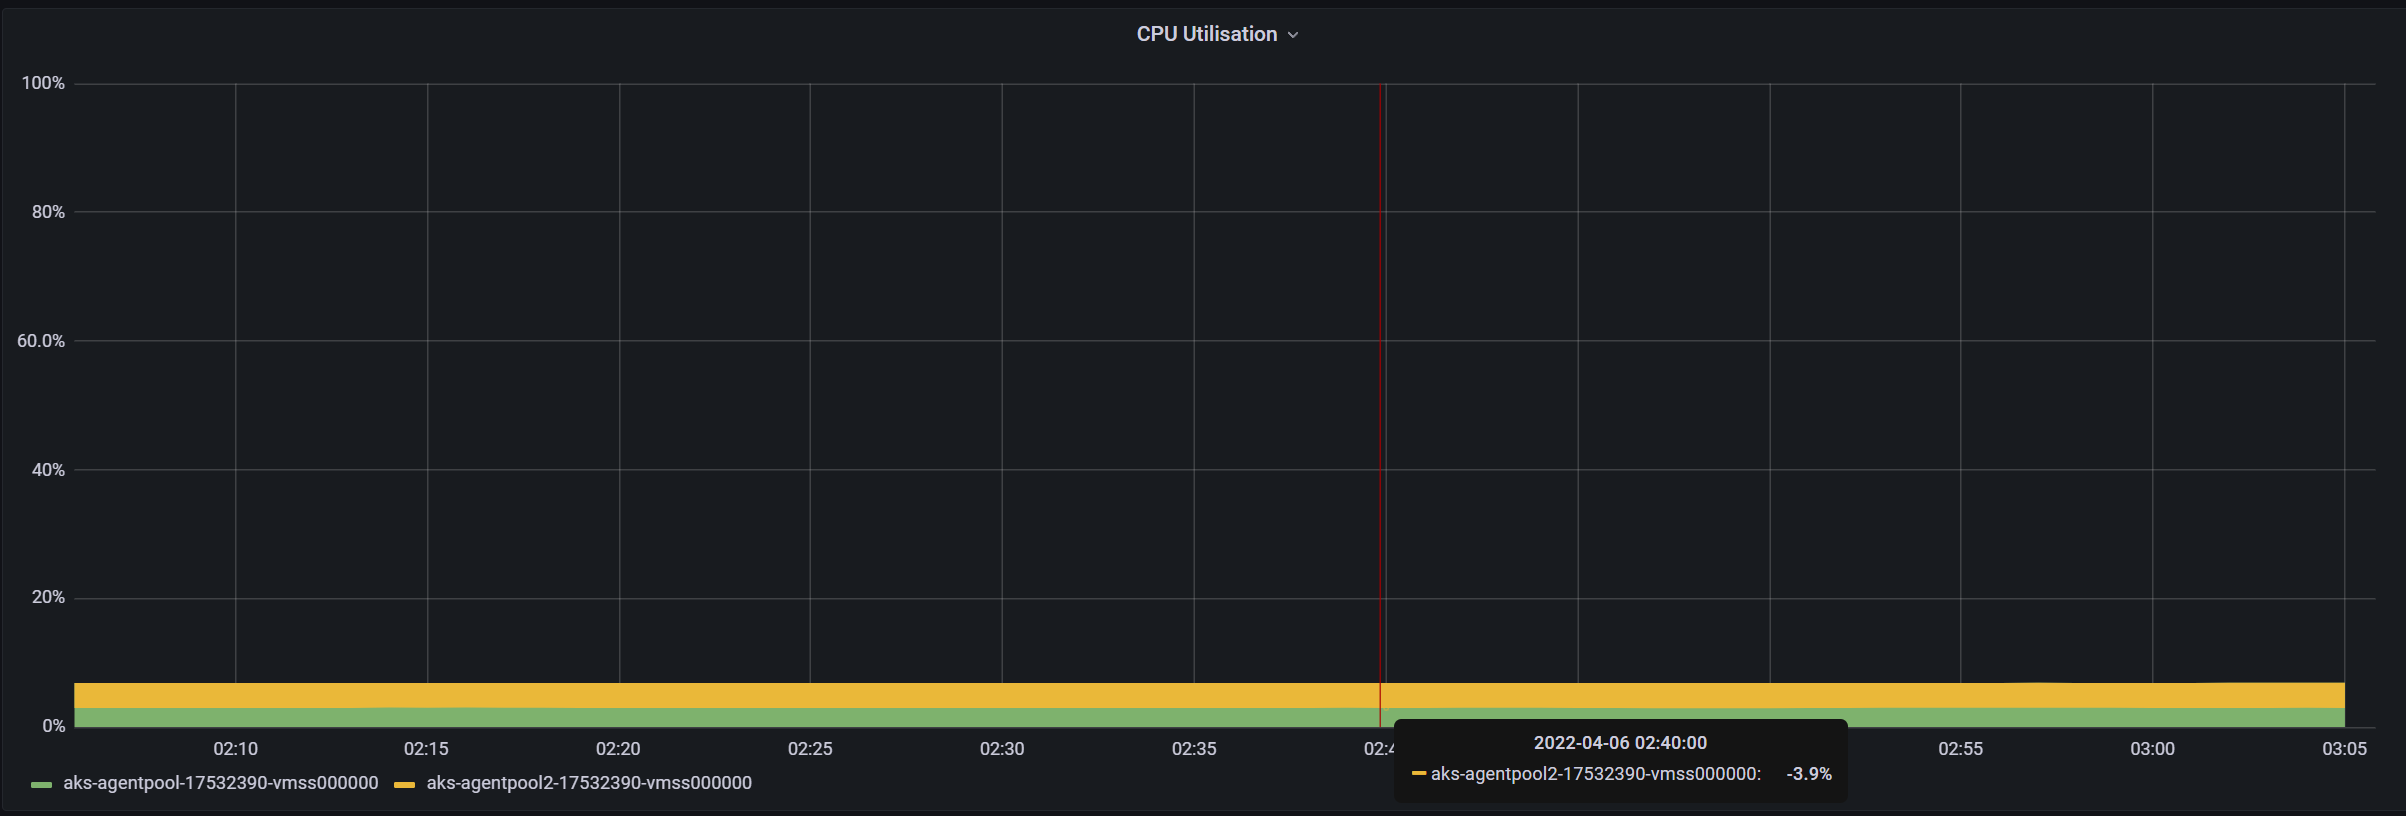
USE Method (cluster) dashboard - CPU Utilisation query
Nobody has claimed this yet.
- Dominant language
- Go
- Stars
- 13.8k
- Forks
- 2.7k
- Avg merge
- 1d 23h
- Merged PRs (30d)
- 8
Description
I am looking at this dashboard panel and it query -- https://github.com/prometheus/node_exporter/blob/b52bf958f8e2d4ed1624b8122d08af4d12da9322/docs/node-mixin/dashboards/use.libsonnet#L229
for my cluster and i see negative values for 'CPU Utilisation'. Can someone please explain what utiliSation means and how is it different from utiliZation ? What does negative value signify here, if its valid ?
Node exporter version - 2.2.0
Contributor guide
First steps
- Read the whole issue, then the project's contributing guide.
- Comment on the issue to say you are picking it up — it saves two people doing the same work.
- Fork the repository and make your change on a branch.
- Open a pull request that references the issue number.
Research direction
Start with the linked query in docs/node-mixin/dashboards/use.libsonnet#L229 and compare it with the reported dashboard behavior and node exporter version. Done means documenting what CPU Utilisation means, whether the spelling difference matters, and whether negative values are valid or indicate a problem.
Written by the indexing model from the issue text.
Assessment
- Tech stack
- prometheus
- Domain
- documentation, observability
- Issue type
- Documentation
- Difficulty
- 4/5
- Estimated time
- 3-5 days
- Activity status
- Stale
- Clarity
- Needs clarification
- Newbie friendliness
- 28/100