prometheus / prometheus/node_exporter
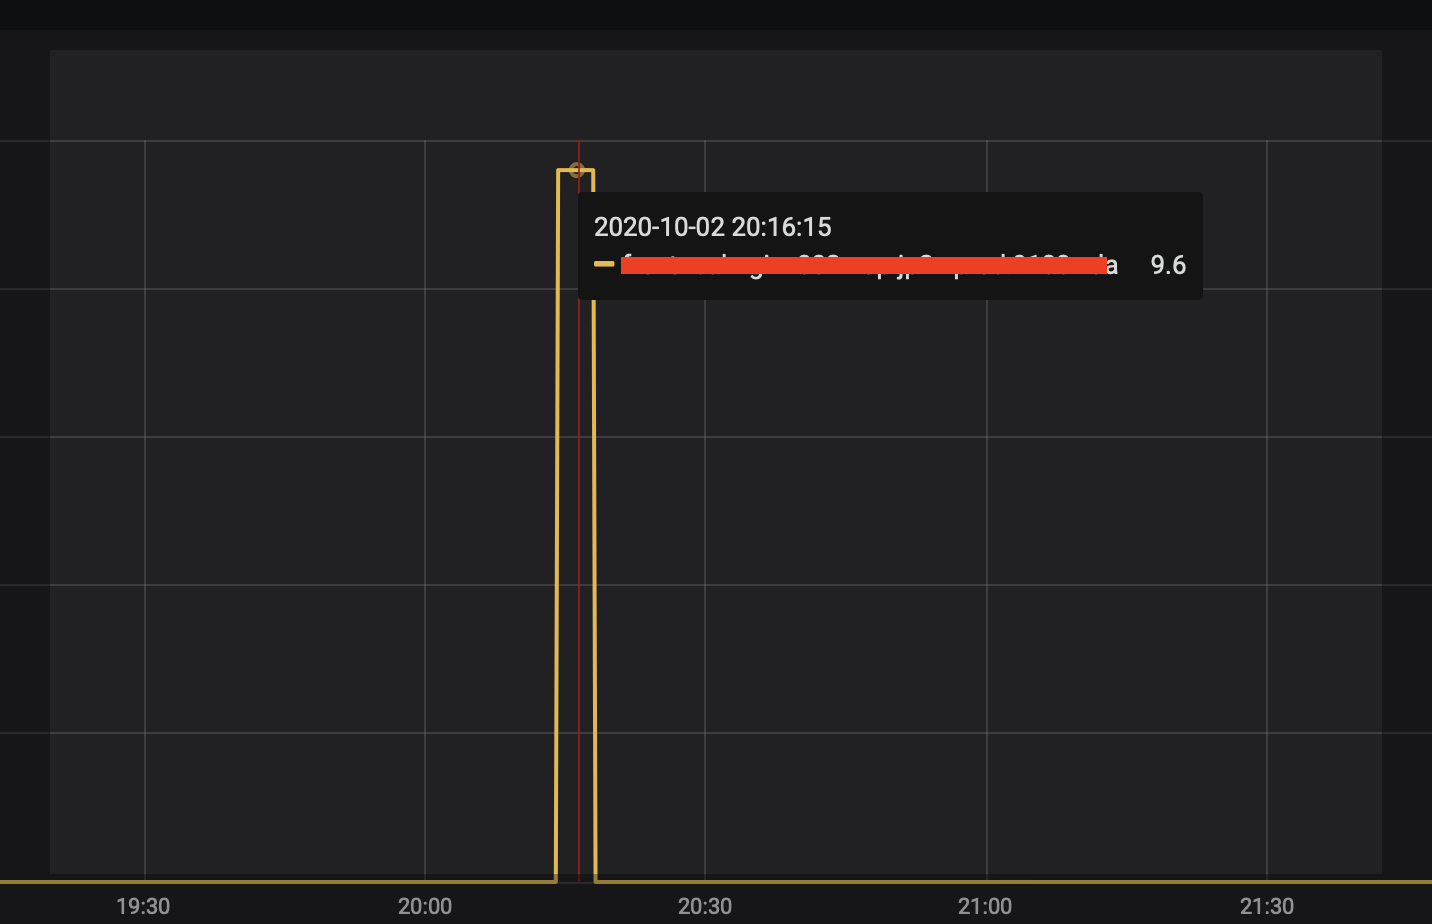
Suddenly big number has happened on the graph
Open
Nobody has claimed this yet.
- Dominant language
- Go
- Stars
- 13.8k
- Forks
- 2.7k
- Avg merge
- 1d 23h
- Merged PRs (30d)
- 8
Description
Host operating system: linux-amd64 CentOS 7.7
node_exporter version: 0.18.1
node_exporter command line flags: Nothing, just enabled
Are you running node_exporter in Docker? No
What did you do that produced an error? Nothing, just monitored
What did you expect to see?
It should be stabled like before, there was no huge traffic at that time.
But I have no idea why that kind of big number was there.
What did you see instead?
rate(node_disk_io_time_seconds_total{instance=~".*real.*"}[5m])
Contributor guide
First steps
- Read the whole issue, then the project's contributing guide.
- Comment on the issue to say you are picking it up — it saves two people doing the same work.
- Fork the repository and make your change on a branch.
- Open a pull request that references the issue number.
Research direction
Start with the supplied rate(node_disk_io_time_seconds_total...) query, the CentOS 7.7 environment, and the attached graph. Reproduce the unexpected spike if possible, then determine whether the reported node_exporter metric or the query explains it; done means the cause is established and the expected stable behavior is documented or corrected.
Written by the indexing model from the issue text.
Assessment
- Tech stack
- go, prometheus
- Domain
- observability
- Issue type
- Bug
- Difficulty
- 4/5
- Estimated time
- 3-5 days
- Activity status
- Stale
- Clarity
- Needs clarification
- Newbie friendliness
- 25/100