pnp / pnp/sp-dev-fx-controls-react
Beta Chart Control need to have option to redraw chart with dynamic data
Nobody has claimed this yet.
- Dominant language
- TypeScript
- Stars
- 433
- Forks
- 418
- Avg merge
- 5d 6m
- Merged PRs (30d)
- 19
Description
Category
[ ] Enhancement
Version
Please specify what version of the library you are using:
"@pnp/spfx-controls-react": "^1.13.0-beta.892b624",
Expected
Charts works fine with the predefined data. But when providing dynamic data to the chart, it's not rendering itself properly according to the data. Chart always shows data from the previous request.
Then i have switched to another library called react-chartjs-2. Which has redraw (Boolean) option as on of the prop. This forces the chart to redraw itself with the provided dynamic data.
react-chartjs-2 redraw method

Steps to Reproduce
You can use the Bet documentation to create line chart (https://github.com/SharePoint/sp-dev-fx-controls-react/blob/dev/docs/documentation/docs/controls/charts/LineChart.md). But instead of using predefined data, Use dynamic data.
For example, Let's suppose you have three different sets of data. You can pass each set of data to chart based on user selection ( For example, 7 day report, 30 day report, 90 report).
Desired Output
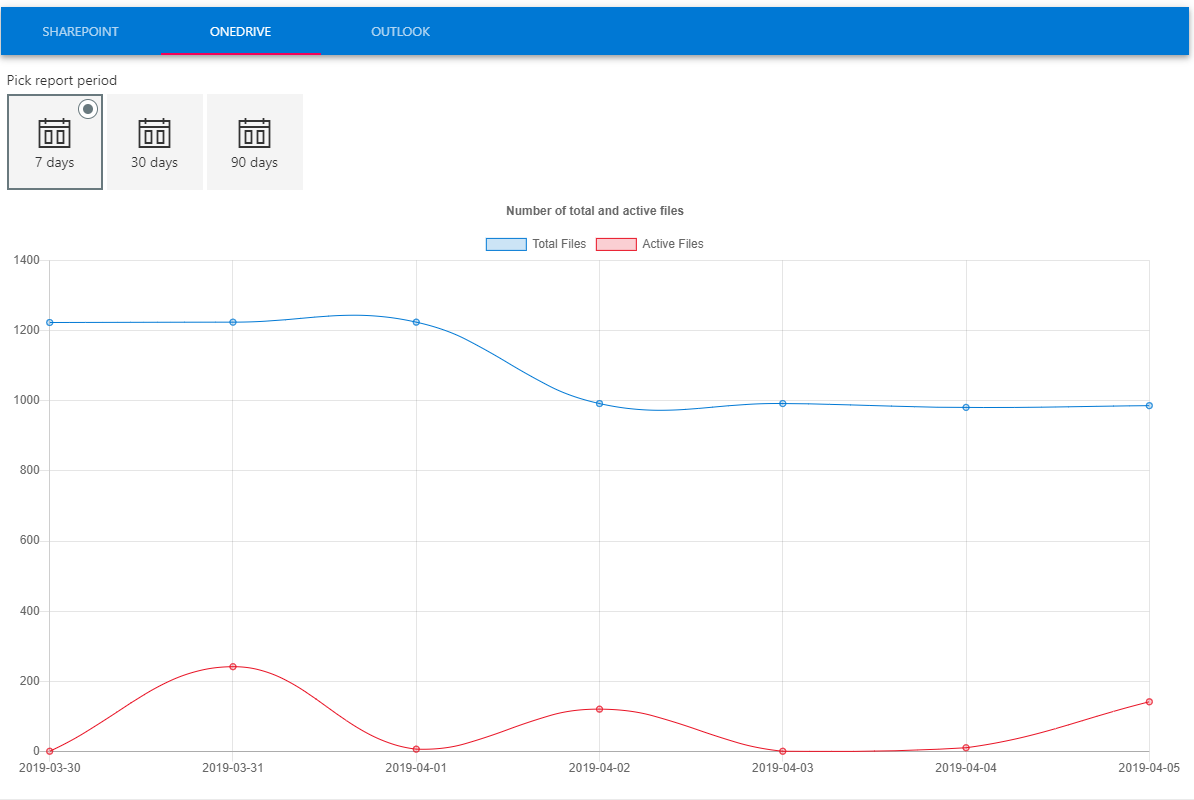
we need to have some sort out force redraw method in chart control
Thanks!
Contributor guide
No contributing guide indexed for this repository
First steps
- Read the whole issue, then the project's contributing guide.
- Comment on the issue to say you are picking it up — it saves two people doing the same work.
- Fork the repository and make your change on a branch.
- Open a pull request that references the issue number.
Research direction
Start with the LineChart example in docs/documentation/docs/controls/charts/LineChart.md, then trace the chart control implementation it uses. Reproduce the issue by switching between three dynamic datasets, and consider the work complete when the displayed chart updates to the selected data instead of retaining the previous request's data.
Written by the indexing model from the issue text.
Assessment
- Tech stack
- react, typescript
- Domain
- data-visualization, frontend
- Issue type
- Feature
- Difficulty
- 3/5
- Estimated time
- 1-2 days
- Activity status
- Stale
- Clarity
- Mostly clear
- Newbie friendliness
- 35/100