[BUG]: Sankey nodes are clipped at the bottom edge when positioned with node.x / node.y
Nobody has claimed this yet.
- Dominant language
- JavaScript
- Stars
- 18.3k
- Forks
- 2k
- Avg merge
- 2d 12h
- Merged PRs (30d)
- 28
Description
Description
When sankey node positions are supplied explicitly via node.x / node.y, nodes placed near the bottom of the plot area (y close to 1) are drawn partly outside the plot area and get visually clipped. The label and the node rect are both cut off.
There are two independent code paths that produce this, and they can be triggered separately:
1. Explicit positioning centers the node on y * height without bounds checking.
In src/traces/sankey/render.js ("Force node position", ~L246-257), the node is centered on the requested position:
var pos = [trace.node.x[i] * width, trace.node.y[i] * height];
var nodeHeight = graph.nodes[i].y1 - graph.nodes[i].y0;
graph.nodes[i].y0 = pos[1] - nodeHeight / 2;
graph.nodes[i].y1 = pos[1] + nodeHeight / 2;
y = 1 means "center of the node at the bottom edge", so half the node always renders below the plot area. The overflow is nodeHeight / 2 at y = 1, and grows with the node's value. Nothing clamps y1 to height, and this happens for every arrangement value, including fixed.
2. resolveCollisionsTopToBottom cascades nodes past the bottom edge.
With arrangement: "snap" (the default), overlapping nodes in a column are pushed downward only (~L183-204). The pass never checks whether the last node ended up below height, so a column whose nodes are clustered near the bottom gets walked straight off the plot area — even when there was plenty of free space above it to absorb the correction. The bundled dependency already handles this: @plotly/d3-sankey@0.7.2 (src/sankey.js:292-299) ends its resolveCollisions with a bottom-bounded upward pass followed by a top-bounded downward pass —
resolveCollisionsBottomToTop(nodes, y1, nodes.length - 1, alpha);  // bottom bound
resolveCollisionsTopToBottom(nodes, y0, 0, alpha);                 // top bound
— whereas render.js declares a local function with the same name as the dep's downward helper, implements only that half, and never calls a counterpart.
Screenshots/Video
Measured on plotly.js v3.7.0 (dist/plotly.min.js from master). The dashed red rectangle is the plot area computed from the layout margins; the readout under each plot measures every .node-rect against it.
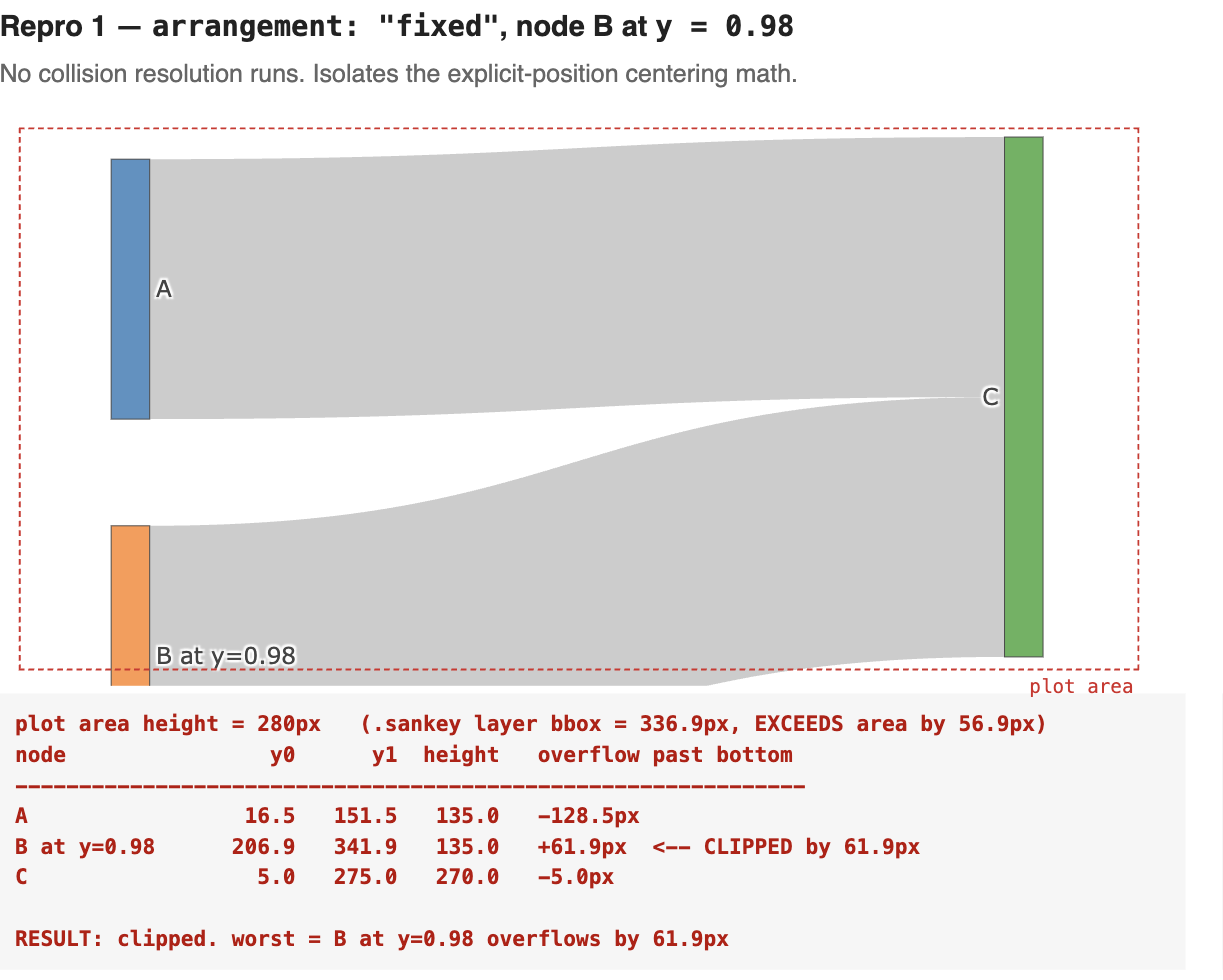
Repro 1 — node B requested at y = 0.98 overflows the 280px plot area by 61.9px (0.98 × 280 + 135/2 − 280). At y = 1.0 the overflow would be the full nodeHeight / 2 = 67.5px. The lower part of the rect and its label are cut off:
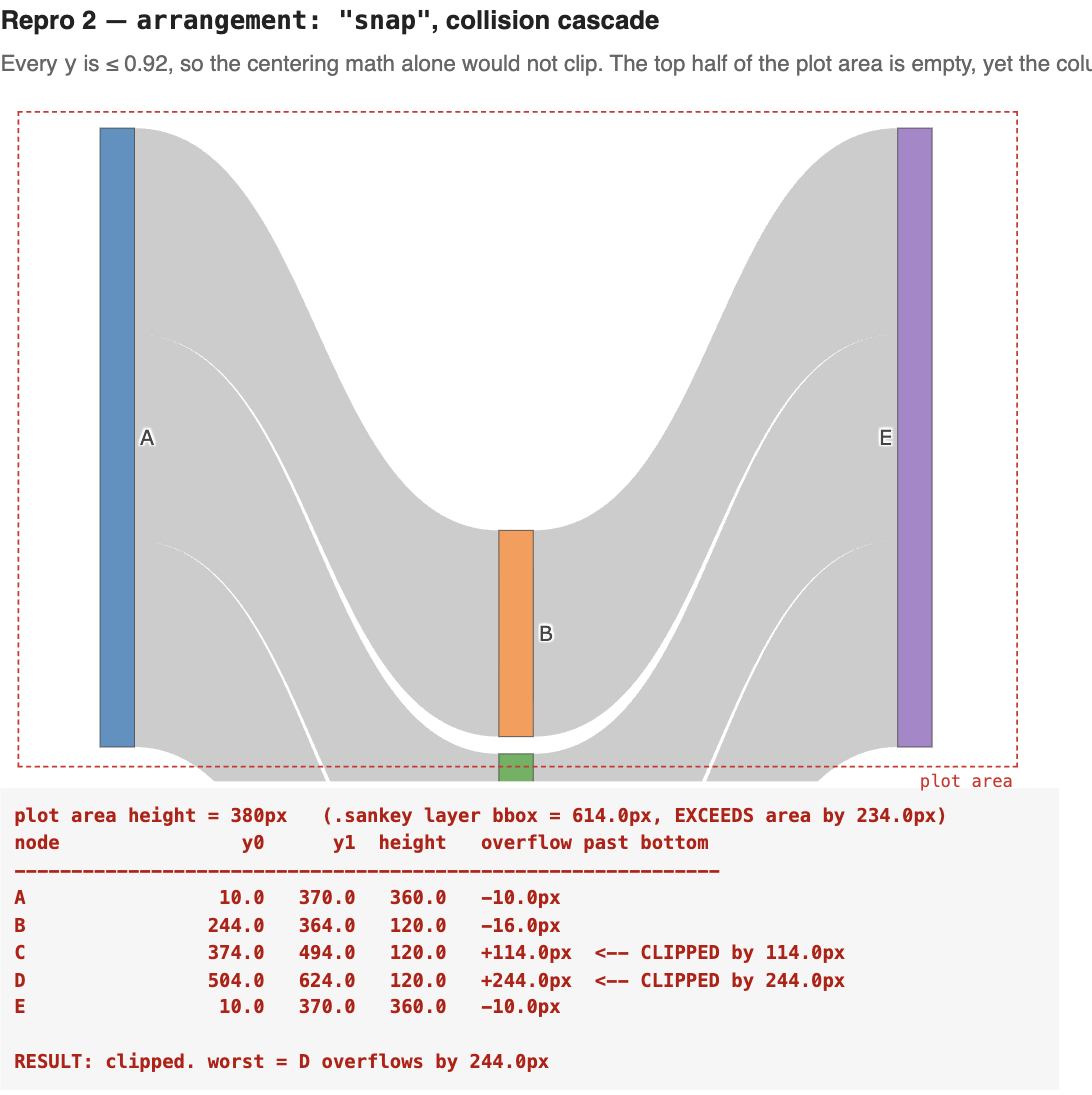
Repro 2 — arrangement: "snap". Nodes C and D are pushed 114px and 244px past the bottom of a 380px plot area. D is invisible; only the top 6px of C renders as a green sliver at the edge. Note the top 244px of the plot area is empty — there was room to absorb the entire cascade:
Control — identical trace to Repro 1 with y = 0.60 instead of 0.98: zero overflow, node renders in full. So this is a bounds bug at the edges, not a node-sizing bug.
Steps to reproduce
Both snippets use plotly.js latest un-minified from https://github.com/plotly/plotly.js/releases, in a <div id="graph">. Margins are pinned so the numbers are deterministic.
Repro 1 — explicit position, no collision resolution involved (arrangement: "fixed" isolates path 1):
Plotly.newPlot('graph', [{
  type: 'sankey',
  arrangement: 'fixed',
  node: {
    label: ['A', 'B at y=0.98', 'C'],
    x: [0.1, 0.1, 0.9],
    y: [0.3, 0.98, 0.5],
    pad: 10
  },
  link: {
    source: [0, 1],
    target: [2, 2],
    value: [10, 10]
  }
}], {
  width: 600,
  height: 300,
  margin: {l: 10, r: 10, t: 10, b: 10}
});
- Note node B: its center sits near the bottom edge and the lower half of the rect (plus its label) is clipped. Measured:
y0 = 206.9,y1 = 341.9in a 280px plot area — 61.9px of overflow.
Repro 2 — arrangement: "snap", collision cascade (isolates path 2; every y here is < 1, so path 1 alone would not clip):
Plotly.newPlot('graph', [{
  type: 'sankey',
  arrangement: 'snap',
  node: {
    label: ['A', 'B', 'C', 'D', 'E'],
    x: [0.1, 0.5, 0.5, 0.5, 0.9],
    y: [0.5, 0.80, 0.86, 0.92, 0.5],
    pad: 10
  },
  link: {
    source: [0, 0, 0, 1, 2, 3],
    target: [1, 2, 3, 4, 4, 4],
    value: [8, 8, 8, 8, 8, 8]
  }
}], {
  width: 600,
  height: 400,
  margin: {l: 10, r: 10, t: 10, b: 10}
});
- Nodes B, C, D share a column and overlap, so they are pushed down in sequence: measured
y0of244,374,504in a 380px plot area. - C overflows by 114px and D by 244px —
Dnever appears at all. The top 244px of the plot area is empty, so the cascade could have been absorbed upward in full.
Measuring this yourself: compare node rects against the plot area derived from the layout (gd.getBoundingClientRect().top + margin.t … + layout.height - margin.b). Do not compare them against the .sankey layer's getBoundingClientRect() — that box is the union of its children, so it stretches to contain the overflow and reports no clipping. In Repro 2 the layer box measures 614px against a 380px plot area.
Expected behaviour
Nodes stay inside the plot area. Specifically:
- An explicitly positioned node is nudged so
y0 >= 0andy1 <= height, rather than being centered on an out-of-bounds point. - Collision resolution that overflows the bottom edge pulls the column back up into the available space above it.
Two cases genuinely cannot fit and should degrade predictably rather than silently hanging off the bottom:
- a single node taller than the plot area — pin it to the top edge (
y0 = 0); - a column whose stacked height exceeds the plot area — respect the bottom edge and let the excess run off the top, which is what the bundled d3-sankey does.
Actual behaviour
y0 / y1 are written past the plot area bounds and the node is clipped by the plot's clip path. No warning is emitted.
Notes
- I have an open PR against this: https://github.com/plotly/plotly.js/pull/7725. Filing this to track the underlying bug and give the PR something to reference.
- Related but distinct, both touching the same explicit-position block in
render.js:- #7758 — explicit
x/ynot respected. Different root cause (index correspondence betweentrace.node.x/yandgraph.nodesbreaks when isolated or phantom nodes are present), but it is the sameforloop, so a fix for either should be written with the other in mind. - #7261 — sankey links leaving the plot boundary under automatic layout. Possibly the same missing-bounds-check family, on links rather than nodes; I have not verified whether they share a cause.
- #7758 — explicit
- The falsy guard noted below and #7758's index mismatch are both in the same 10 lines, which suggests that block could use one consolidated pass rather than three separate patches. Happy to scope this PR narrowly to the clipping and leave that to a follow-up.
- Adjacent and possibly a separate issue: the guard on the explicit-position branch is
if(trace.node.x[i] && trace.node.y[i]), which is falsy for0. A node requested at exactlyx = 0ory = 0is silently skipped and keeps its computed position. Happy to split that out if you'd rather keep this issue to the bottom-edge case.
Contributor guide
First steps
- Read the whole issue, then the project's contributing guide.
- Comment on the issue to say you are picking it up — it saves two people doing the same work.
- Fork the repository and make your change on a branch.
- Open a pull request that references the issue number.
Research direction
Start in src/traces/sankey/render.js at the explicit-position block around L246-257 and the local resolveCollisionsTopToBottom function around L183-204. Compare collision handling with @plotly/d3-sankey@0.7.2 in src/sankey.js:292-299, then run both supplied reproductions. Done means explicitly positioned and snap-layout nodes remain within the plot area, including the stated oversized-node cases.
Written by the indexing model from the issue text.
Assessment
- Tech stack
- d3, javascript
- Domain
- data-visualization
- Issue type
- Bug
- Difficulty
- 3/5
- Estimated time
- 1-2 days
- Activity status
- Quiet
- Clarity
- Clearly specified
- Newbie friendliness
- 35/100