X and Y axis values repeat when the data is constant
Open
Nobody has claimed this yet.
bug
P2
- Dominant language
- JavaScript
- Stars
- 18.3k
- Forks
- 2k
- Avg merge
- 2d 12h
- Merged PRs (30d)
- 28
Description
Issue:
- Y axis values repeat when there is constant data in the graph
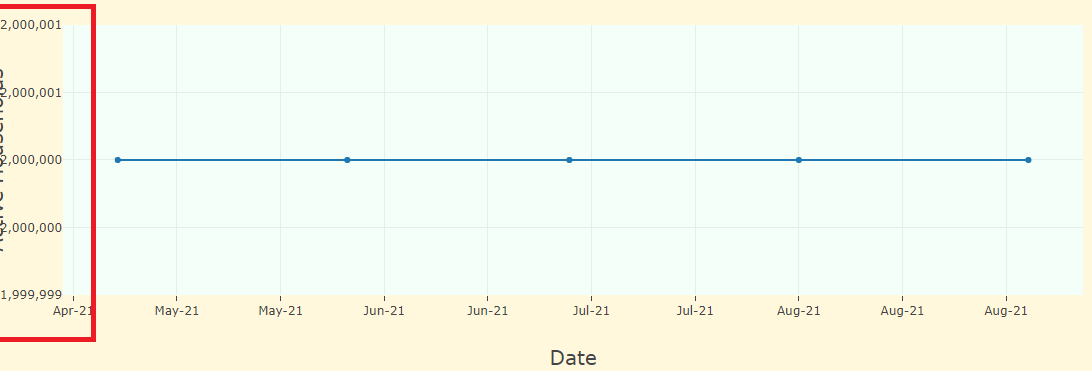
- X axis values also repeats even after setting up the nticks value correctly (to the number of months selected) .
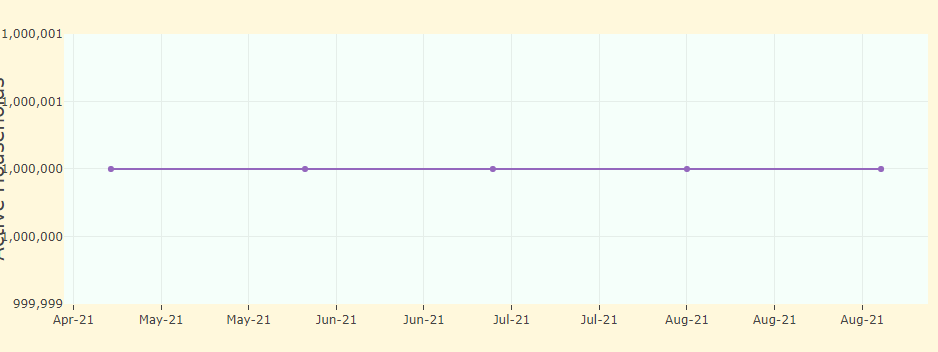
Please suggest a work around to fix the issue.
Contributor guide
First steps
- Read the whole issue, then the project's contributing guide.
- Comment on the issue to say you are picking it up — it saves two people doing the same work.
- Fork the repository and make your change on a branch.
- Open a pull request that references the issue number.
Research direction
The issue provides screenshots but no repository files, test case, or reproducible example. Start by creating a minimal chart with constant data and checking both axes while setting nticks; done means the axis labels no longer repeat and the requested tick count is respected.
Written by the indexing model from the issue text.
Assessment
- Tech stack
- javascript
- Domain
- data-visualization
- Issue type
- Bug
- Difficulty
- 4/5
- Estimated time
- 3-5 days
- Activity status
- Stale
- Clarity
- Needs clarification
- Newbie friendliness
- 25/100