ggplotly does not respect group variable when used with color variable
Nobody has claimed this yet.
- Dominant language
- R
- Stars
- 2.7k
- Forks
- 641
- PR merge metrics
- No merged PRs in 30d
Description
Hi,
The following is affecting my ability to use ggplotly:
When color = Species and group = 1, all dots should be connected, irrespective of species, but ggplotly does not respect the group variable and it is as if I only wrote color = Species.
Thanks for your work on this great library! If there is a workaround please let me know.
With ggplotly:

only ggplot:
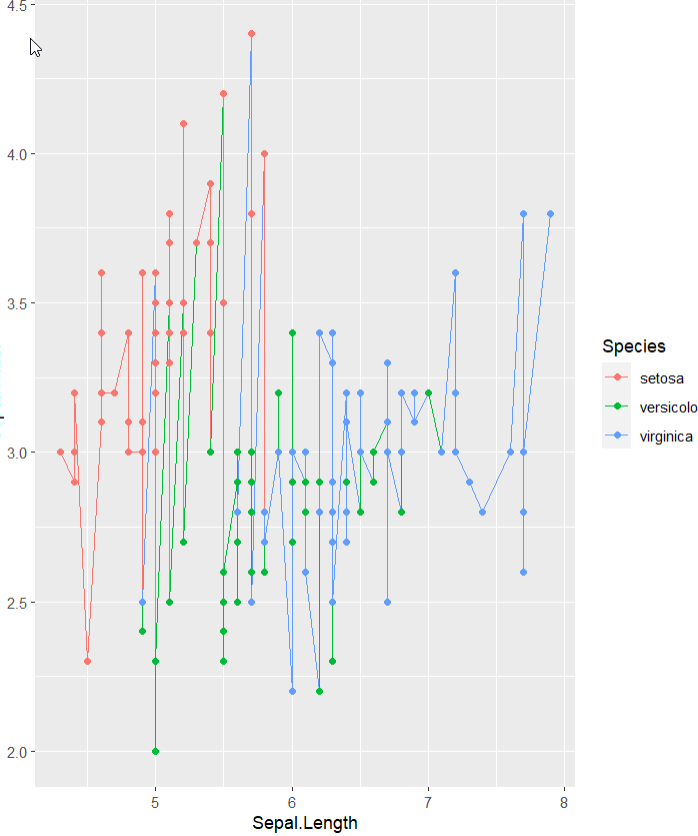
ggplotly(ggplot(data = iris) +
  geom_line(mapping = aes(Sepal.Length, Sepal.Width, color = Species, group = 1)) +
  geom_point(mapping = aes(Sepal.Length, Sepal.Width, color = Species, group = 1)))
Contributor guide
First steps
- Read the whole issue, then the project's contributing guide.
- Comment on the issue to say you are picking it up — it saves two people doing the same work.
- Fork the repository and make your change on a branch.
- Open a pull request that references the issue number.
Research direction
Start with the provided ggplotly call using iris, geom_line, geom_point, color = Species, and group = 1, then compare its output with the plain ggplot result. Trace how ggplotly handles the group variable when a color variable is also mapped; done means dots are connected across species as in the ggplot output.
Written by the indexing model from the issue text.
Assessment
- Tech stack
- r
- Domain
- data-visualization
- Issue type
- Bug
- Difficulty
- 4/5
- Estimated time
- 3-5 days
- Activity status
- Stale
- Clarity
- Mostly clear
- Newbie friendliness
- 35/100