change behavior of grouping in go.Scatter x axes
Open
Nobody has claimed this yet.
feature
P3
- Dominant language
- Python
- Stars
- 24.4k
- Forks
- 2.3k
- Avg merge
- 2d 7h
- Merged PRs (30d)
- 13
Description
When plotting a go.Scatter with many values in the x axis, the points suddenly get grouped, so for the same visible point, multiple values are represented.
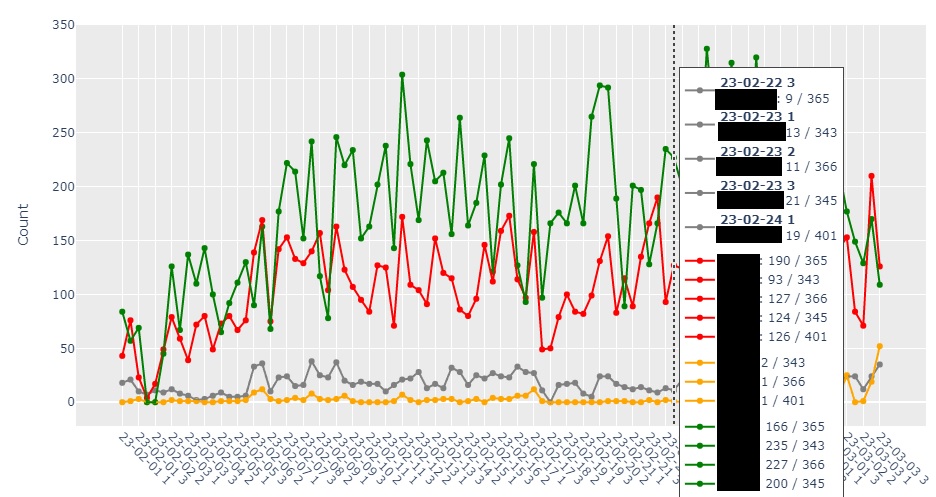
How can I represent all datapoints separately, independently of how big my x axis is?
Thank you!
Contributor guide
First steps
- Read the whole issue, then the project's contributing guide.
- Comment on the issue to say you are picking it up — it saves two people doing the same work.
- Fork the repository and make your change on a branch.
- Open a pull request that references the issue number.
Research direction
The issue names no files, tests, or entry points. Start by reproducing the go.Scatter chart with many x-axis values and compare the grouped points with the requested separate rendering; done means all datapoints remain separately represented regardless of the x-axis size.
Written by the indexing model from the issue text.
Assessment
- Tech stack
- python
- Domain
- data-visualization
- Issue type
- Bug
- Difficulty
- 4/5
- Estimated time
- 3-5 days
- Activity status
- Stale
- Clarity
- Needs clarification
- Newbie friendliness
- 25/100