imshow facet plots integrated in dash not preserving grid structure when number of elements is changed
Nobody has claimed this yet.
- Dominant language
- Python
- Stars
- 24.4k
- Forks
- 2.3k
- Avg merge
- 2d 7h
- Merged PRs (30d)
- 13
Description
Describe your context
Please provide us your environment, so we can easily reproduce the issue.
dash                              2.6.1
dash-bootstrap-components         1.2.1
dash-core-components              2.0.0
dash-html-components              2.0.0
dash-table                        5.0.0
jupyter-dash                      0.4.2
-
if frontend related, tell us your Browser, Version and OS
- OS: windows 10 pro
- Browser Chrome and Microsoft Edge
Describe the bug
I am trying to integrate facet plots with imshow into a dash application with a variable number of elements. The number of subplots can be changed by user interaction, as in the following minimal example:
from dash import Output, Input
import dash
import dash_core_components as dcc
import dash_html_components as html
import plotly.express as px
from skimage import io

data = io.imread("https://github.com/scikit-image/skimage-tutorials/raw/main/images/cells.tif")
img = data[20:45:2]
img = img[0:4, :, :]
fig = px.imshow(img, facet_col=0, binary_string=True, facet_col_wrap=5)

app = dash.Dash()
app.layout = html.Div(children=[html.Div(id="container", children=dcc.Graph(id="figure", figure=fig)),
                                dcc.RadioItems(
                                    id="labels",
                                    options=[{"label": str(idx), "value": idx} for idx in range(12)],
                                    value=4)],
                      style={"height": "80%",
                             "width": "50%"})


@app.callback(
    Output("container", "children"),
    Input("labels", 'value')
)
def create_facet_plot(labels):
    data = io.imread("https://github.com/scikit-image/skimage-tutorials/raw/main/images/cells.tif")
    img = data[20:45:2]
    cols = int(labels)
    img = img[0:cols, :, :]
    fig = px.imshow(img, facet_col=0, binary_string=True, facet_col_wrap=5)
    return dcc.Graph(id="figure", figure=fig)


app.run_server(debug=True, use_reloader=False, port=8856)  # Turn off reloader if inside Jupyter
For the first call, the grid is as expected. When the number of facet elements is changed, the grid gets distorted and some individual elements are out of line. Depending on what the first setting is, different settings do not work as expected. The facet titles seem to work correctly, but the image subplots are not. Running the same code without dash, only with plotly in a jupyter notebook, the facet plot is always as expected. Thus, the error only occurs when the facet plot is integrated in a dash application. Based on the behavior, it seems that some internal rendering settings are not updated when the plot is generated again by the callback.
A quick test suggests that the same behavior does not occur with histograms and seems to be a problem with only imshow.
Expected behavior
Regular grid in facet plot when changing the number of elements in a dash application.
Screenshots
1st run:
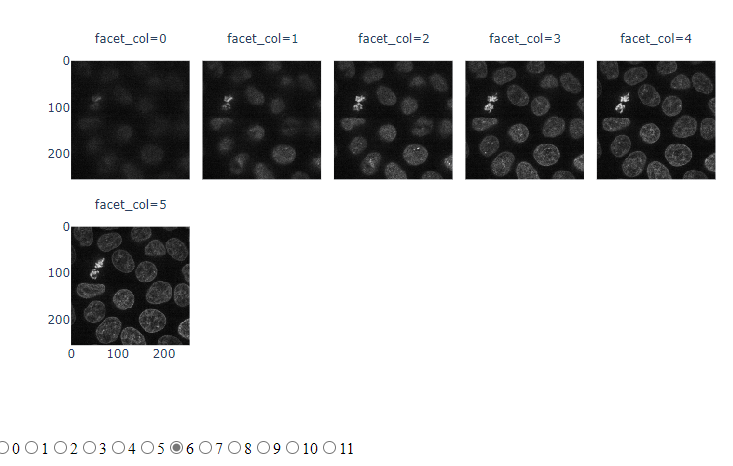
first call with initially 6 elements - working

changing it to 4 - not working
2nd run (new call):
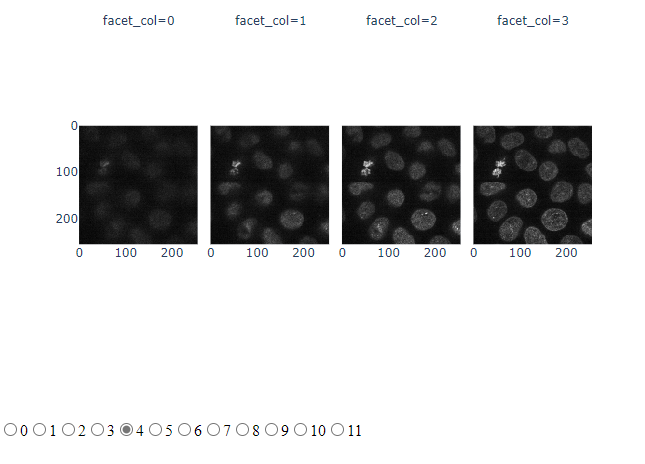
first call with initially 4 elements - working
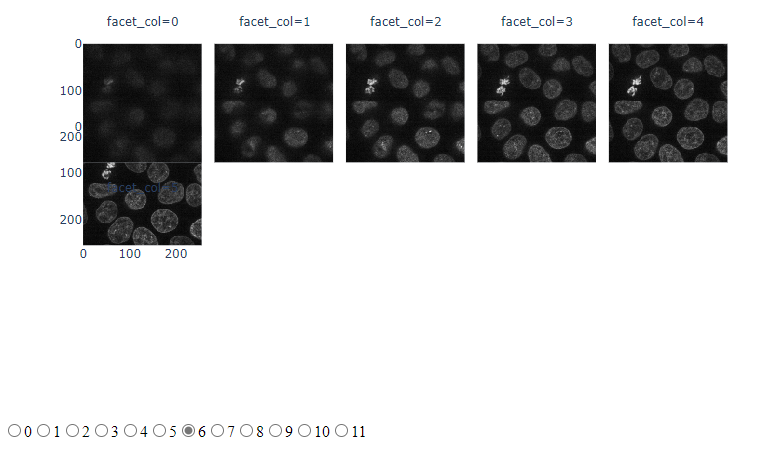
changing it to 6 - not working
Contributor guide
First steps
- Read the whole issue, then the project's contributing guide.
- Comment on the issue to say you are picking it up — it saves two people doing the same work.
- Fork the repository and make your change on a branch.
- Open a pull request that references the issue number.
Research direction
Start with the provided Dash callback reproduction and compare the imshow facet layout after changing the element count with the same plot in a Jupyter notebook. Trace the Dash-rendered figure update and the imshow facet grid state; done means the subplot images remain in a regular grid after changing the number of elements.
Written by the indexing model from the issue text.
Assessment
- Tech stack
- python
- Domain
- data-visualization, frontend
- Issue type
- Bug
- Difficulty
- 4/5
- Estimated time
- 3-5 days
- Activity status
- Stale
- Clarity
- Mostly clear
- Newbie friendliness
- 35/100