When changing content of dcc.graph from one with locked axes ratio, to another with different axis domain, the domain is not updated
Open
Nobody has claimed this yet.
bug
P3
- Dominant language
- Python
- Stars
- 24.4k
- Forks
- 2.3k
- Avg merge
- 2d 7h
- Merged PRs (30d)
- 13
Description
Environment
dash                      2.4.1
dash-core-components      2.0.0
dash-html-components      2.0.0
dash-table                5.0.0
plotly                    5.8.0
- OS: Arch linux
- Browser: Chromium
- Version 102.0.5005.61 (Official Build) Arch Linux (64-bit)
Describe the bug
MWE:
from dash import Input, Output, Dash, html, dcc
import plotly.graph_objects as go


app = Dash(__name__)

app.layout = html.Div(
    [
        dcc.Dropdown(id="dropdown", value="1", options=["1", "2", "3"]),
        dcc.Graph(id="plot", style={"height": "85vh"}),
    ],
)


def get_graph_1():
    layout = {"xaxis": {}, "yaxis": {"scaleanchor": "x", "scaleratio": 1}}
    fig = go.Figure(layout=layout)
    fig.add_trace(go.Scatter(x=[0, 1, 2], y=[0, 1, 0]))
    return fig


def get_graph_2():
    layout = {"xaxis": {}, "yaxis": {"domain": [0.0, 0.5]}}
    fig = go.Figure(layout=layout)
    fig.add_trace(go.Scatter(x=[0, 1, 2], y=[1, 0, 1]))
    return fig


@app.callback(
    Output("plot", "figure"),
    Input("dropdown", "value"),
)
def dnum_cb(val):
    if val == "1":
        return get_graph_1()
    else:
        return get_graph_2()


if __name__ == "__main__":
    app.run_server(debug=True)
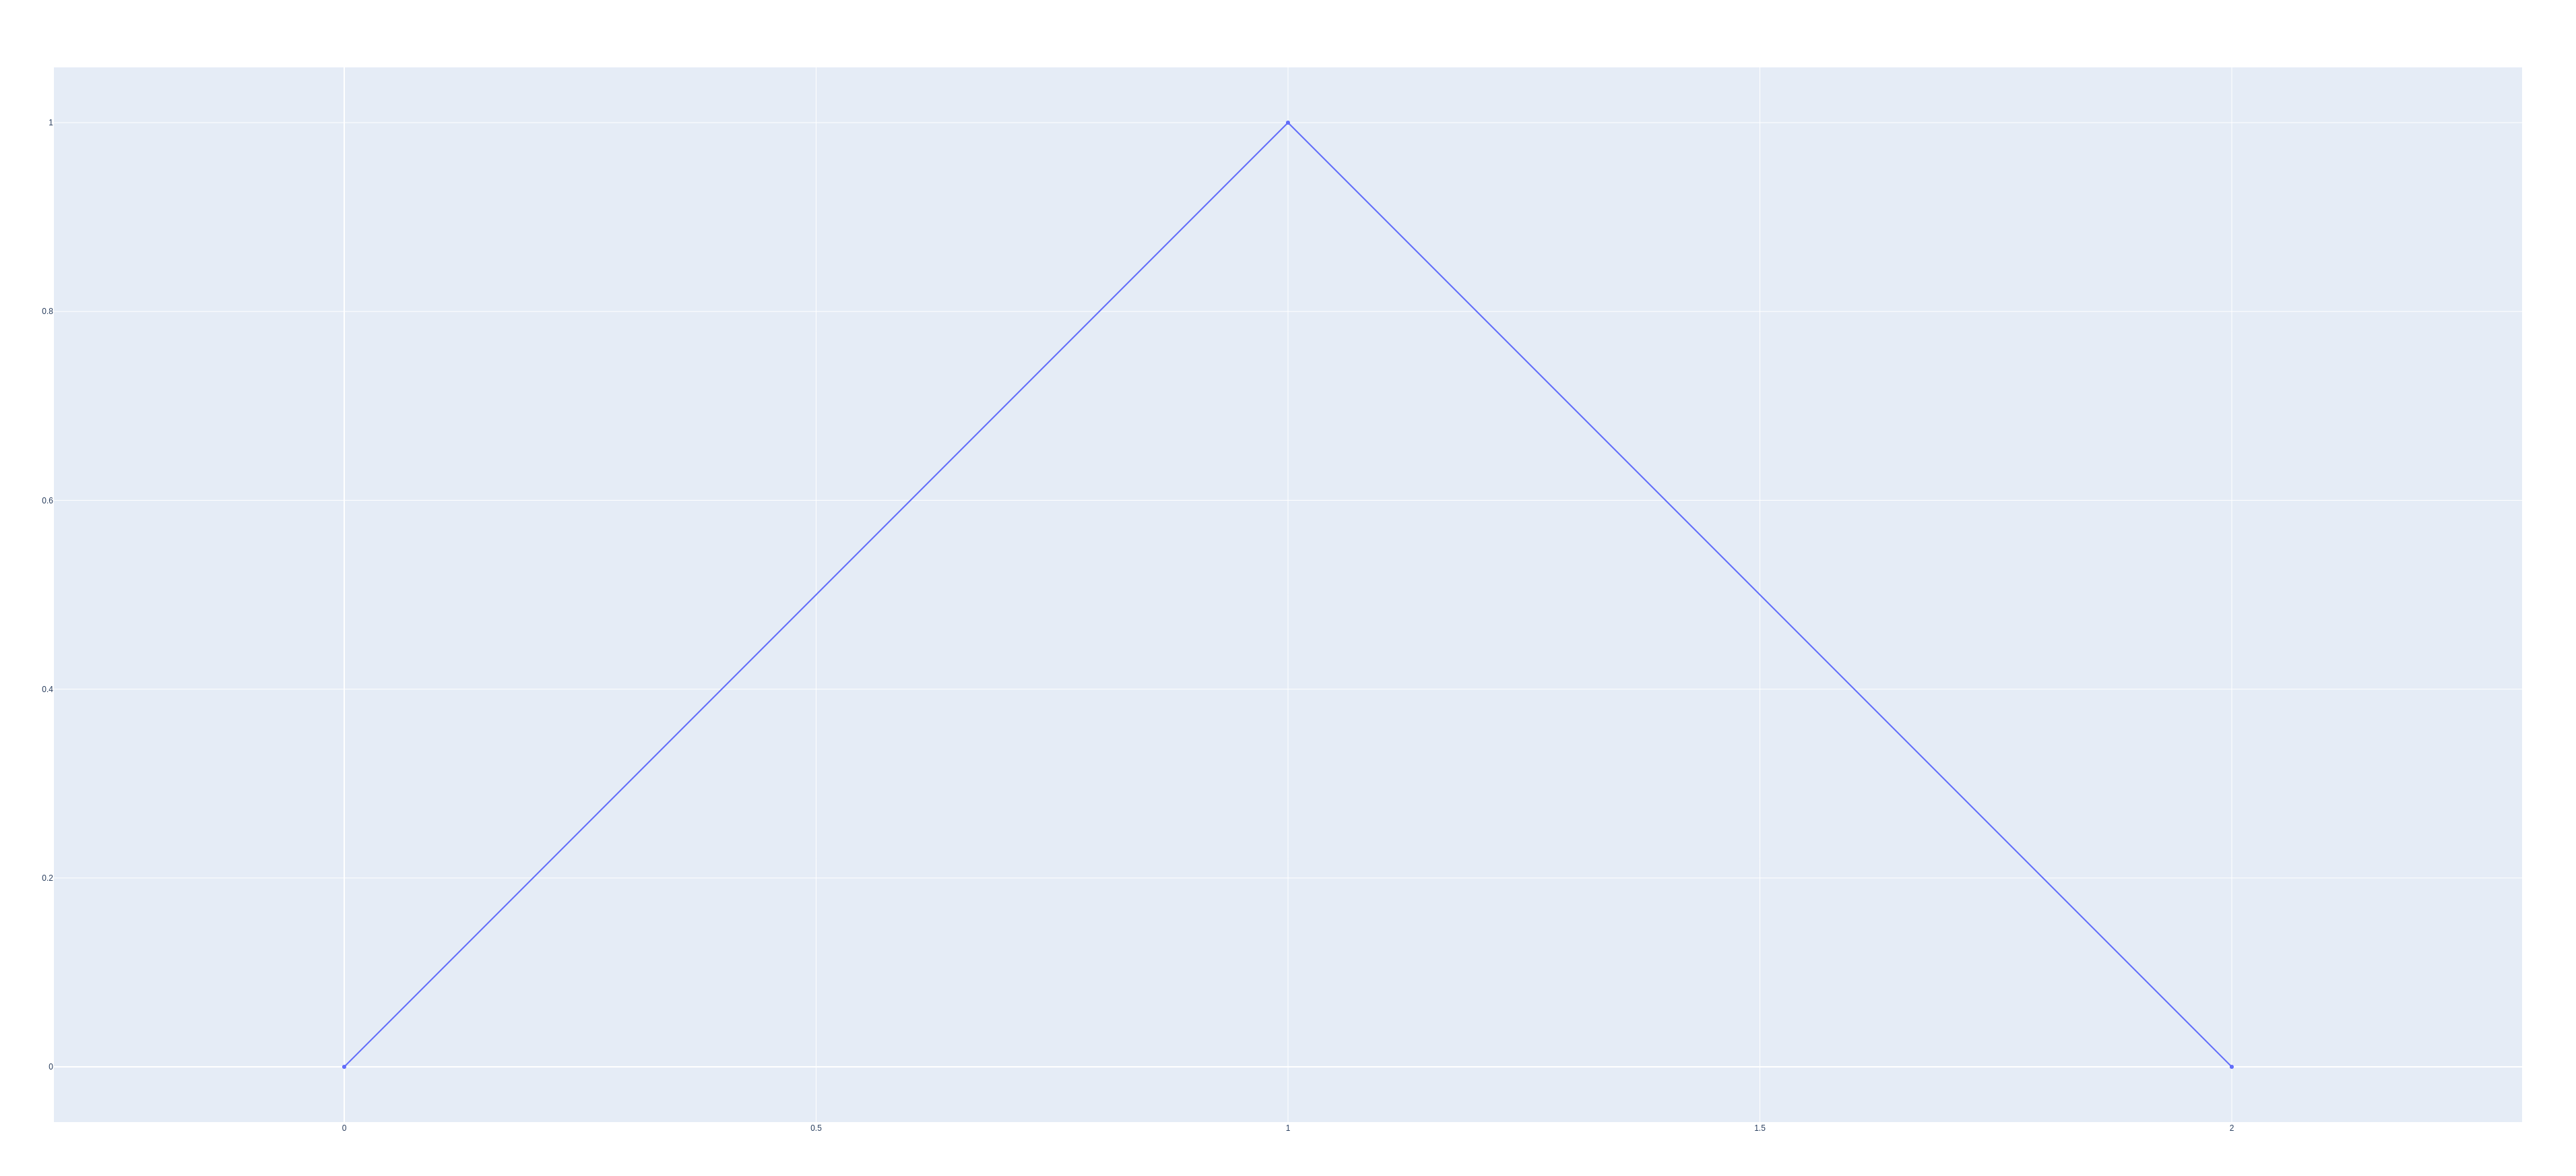
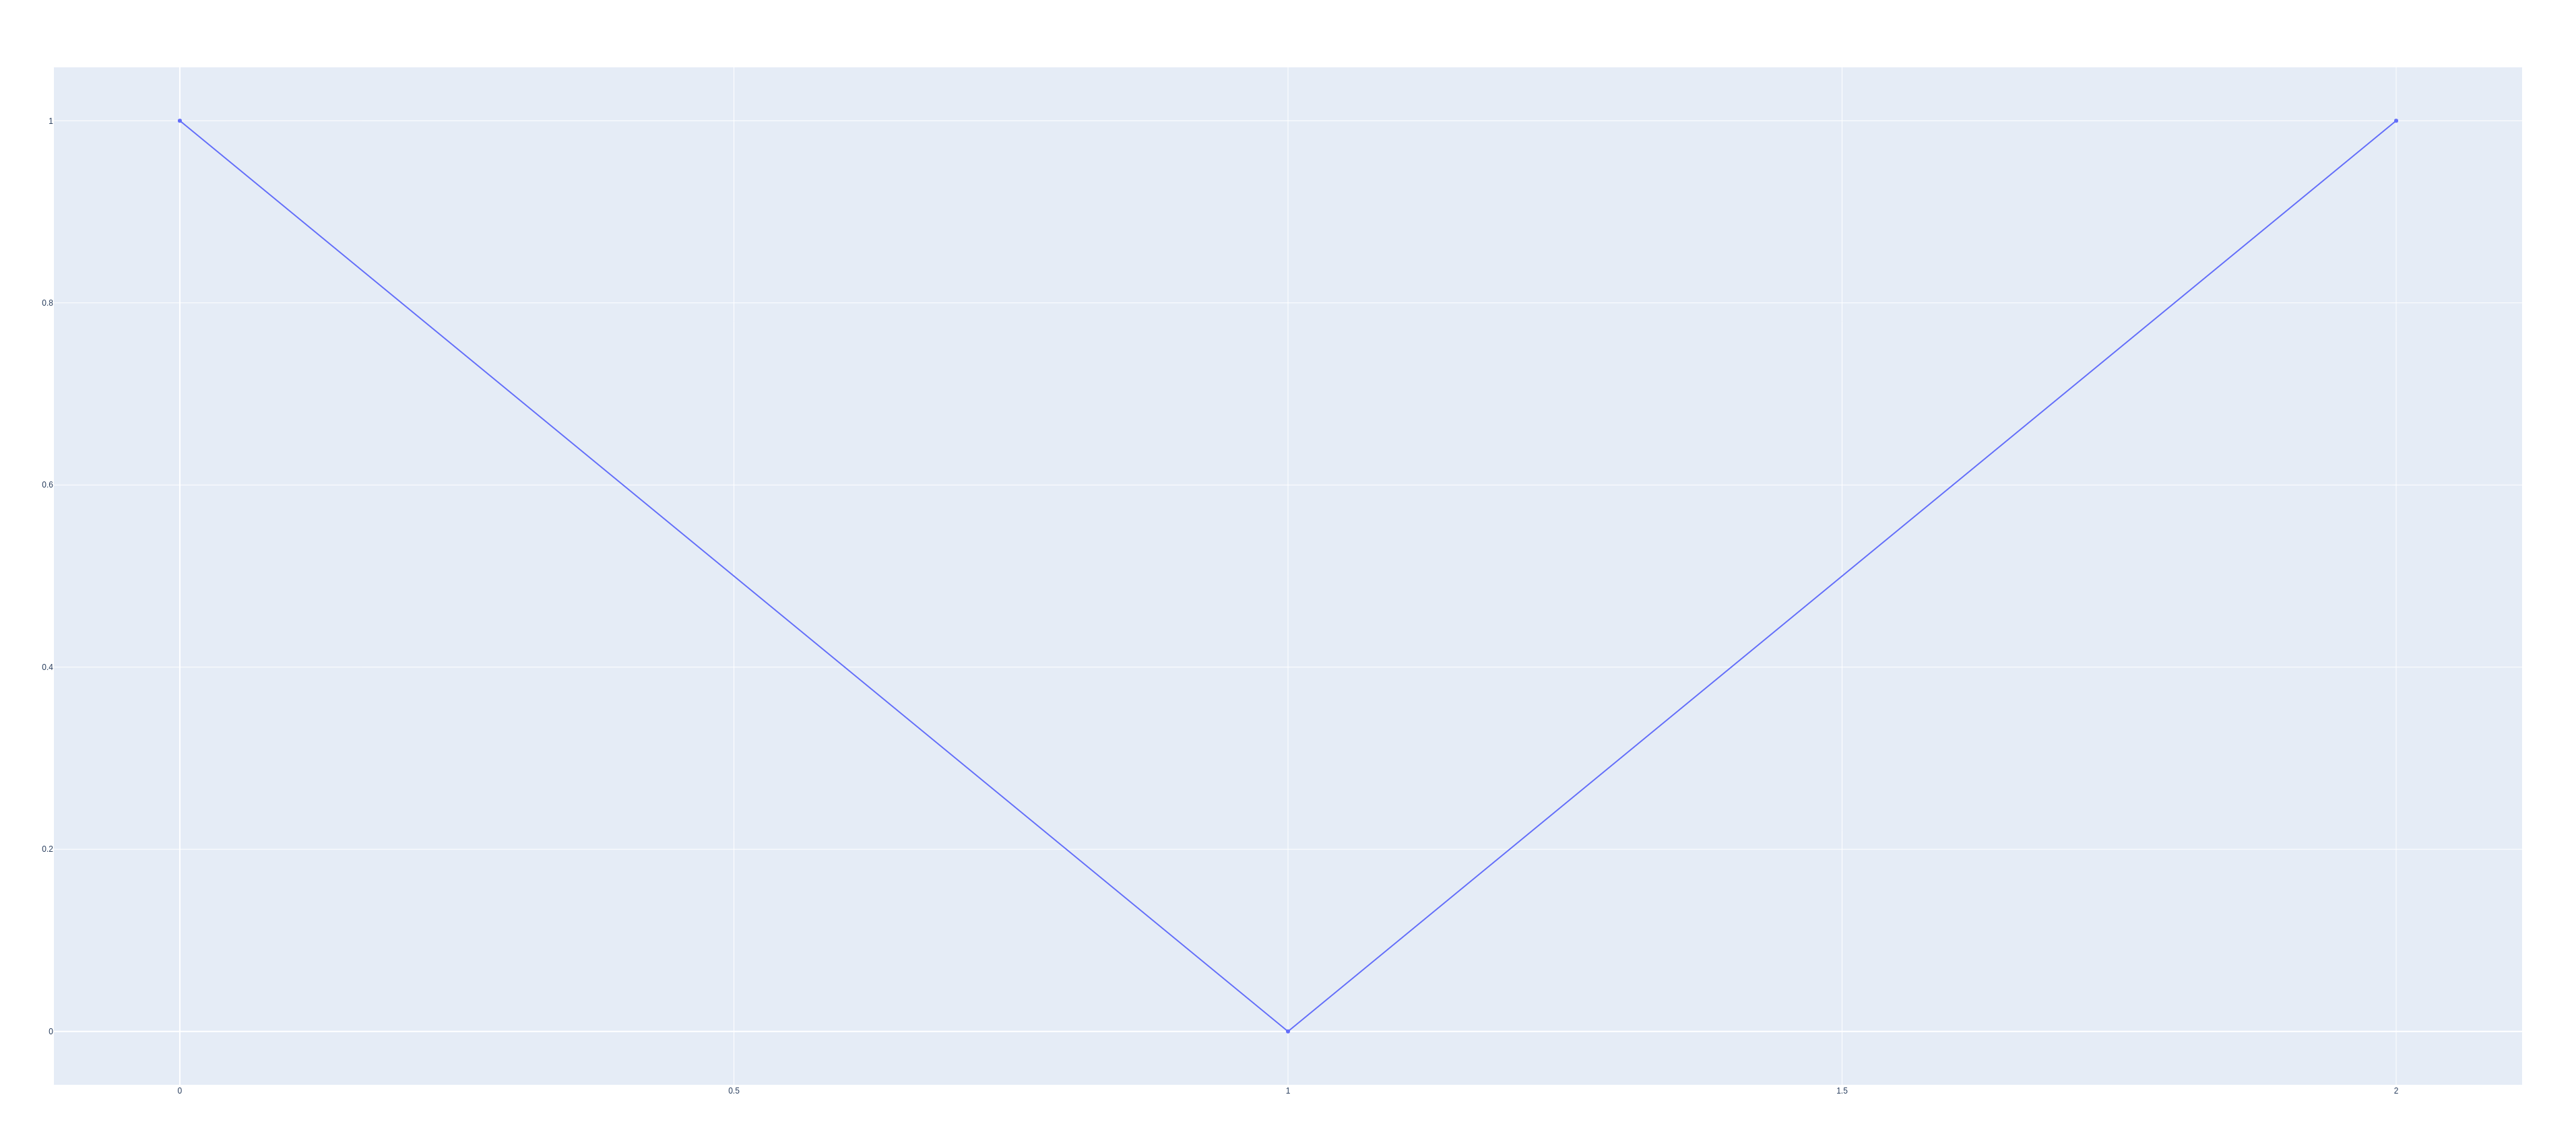
When changing graph from one with locked axes ratio, to another with different axis domain, the domain is not updated.
Steps to reproduce:
- Run the MWE server (screenshot 1).
- Switch dropdown from value "1" to value "2".
- Observe that y axis domain has not updated (screenshot 2).
- Switch dropdown from value "2" to value "3".
- Observe that domain has updated, even though the same graph was returned in the callback (screenshot 3).
Expected behavior
The axis domain is correctly updated regardless of previous dcc.Graph content.
Screenshots
Screenshot 1:
Screenshot 2:
Screenshot 3:

Contributor guide
First steps
- Read the whole issue, then the project's contributing guide.
- Comment on the issue to say you are picking it up — it saves two people doing the same work.
- Fork the repository and make your change on a branch.
- Open a pull request that references the issue number.
Research direction
Start by running the minimal Dash app in the issue and reproduce the dcc.Graph transition from value "1" to value "2". Trace the graph update path for changes from locked axis scaling to an explicit y-axis domain, then verify that the domain updates on the first switch without requiring a second callback update.
Written by the indexing model from the issue text.
Assessment
- Tech stack
- plotly, python
- Domain
- data-visualization, frontend
- Issue type
- Bug
- Difficulty
- 4/5
- Estimated time
- 3-5 days
- Activity status
- Stale
- Clarity
- Clearly specified
- Newbie friendliness
- 48/100