Plotly express image background disappears when the chart is included in dash
Nobody has claimed this yet.
- Dominant language
- Python
- Stars
- 24.4k
- Forks
- 2.3k
- Avg merge
- 2d 7h
- Merged PRs (30d)
- 13
Description
Hi,
I have added the logo of the company who owns the data on kaggle to my plotly express chart. On the jupyter notebook when I run fig.show() the image is displayed in the background as specified. However, when I include the figure in the dash app, the logo is not displayed when I visit the URL of dash app. Why is this happening and how to fix this?
plotly express code:
india = px.line(df[df.cityName=='India'], x="month", y="Final_Price_Index", color="bedrooms",template='simple_white+gridon', line_shape='linear', labels={"bedrooms": "Type"}, category_orders={"bedrooms":['1-BHK', '2-BHK', '3-BHK', 'ALL']})
india.update_traces(line=dict(width=2), hovertemplate=None)
india.update_layout(
images=[dict(source="housing_black.jpg",xref="paper", yref="paper",x=0.2,  y=.7,sizex=.3, sizey=.8,xanchor="center", yanchor="bottom",
        sizing= "contain",opacity= 0.7,visible = True,layer= "below")],
    hovermode="x unified",
    autosize=True,
    xaxis_title="Date Range Slider",
    yaxis_title="",
    title="India",
    legend_title="",
    legend=dict(orientation="h",yanchor="bottom",y=1.05,xanchor="right",x=1),
    font=dict(family="Helvetica, Bold", size=14,color="Black"),
    xaxis=dict(rangeslider=dict(visible=True,thickness=.12,bgcolor= 'lightgrey'),type="date")
)
india.layout.legend.itemsizing = 'constant'
india.show()
output:
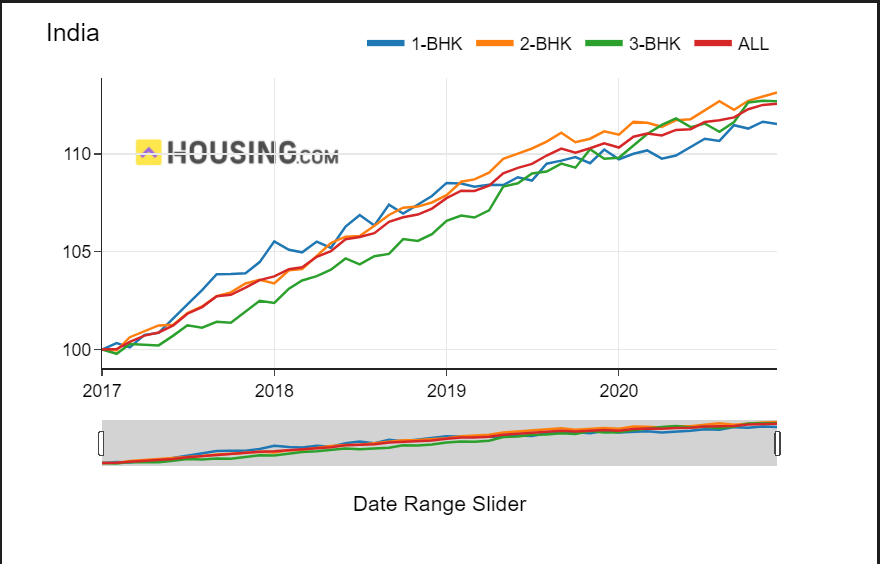
dash code:
app = dash.Dash(__name__, meta_tags=[{
      'name': 'viewport',
      'content': 'width=device-width, initial-scale=1.0'
    }], prevent_initial_callbacks=True)

server=app.server
abs_styles = {'display': 'inlineBlock', 'height': 'auto', 'width': 'auto',
               'position': 'fixed', "background": "#323130", 'top': '12.5vh', 'left': '7.5vw',
               'border': 'grey', 'border-radius': '4px'}

tab_style = {
    "background": "#323130",
    'text-transform': 'uppercase',
    'color': 'white',
    'border': '#A9A9A9',
    'font-size': '10px',
    'font-weight': 600,
    'align-items': 'center',
    'justify-content': 'center',
    'border-radius': '4px',
    'padding':'6px'
}

tab_selected_style = {
    "background": "#A9A9A9",
    'text-transform': 'uppercase',
    'color': 'white',
    'font-size': '10px',
    'font-weight': 600,
    'align-items': 'center',
    'justify-content': 'center',
    'border-radius': '4px',
    'padding':'6px'
}

app.layout = html.Div([
    dcc.Tabs(id='tabs-example', value='tab-1', mobile_breakpoint=0, children=[
        dcc.Tab(label='India', value='tab-1',style=tab_style, selected_style=tab_selected_style),
        dcc.Tab(label='Ahmedabad', value='tab-2',style=tab_style, selected_style=tab_selected_style),
        dcc.Tab(label='Bengaluru', value='tab-3',style=tab_style, selected_style=tab_selected_style),
        dcc.Tab(label='Chennai', value='tab-4',style=tab_style, selected_style=tab_selected_style),
        dcc.Tab(label='Hyderabad', value='tab-5',style=tab_style, selected_style=tab_selected_style),
        dcc.Tab(label='Kolkata', value='tab-6',style=tab_style, selected_style=tab_selected_style),
        dcc.Tab(label='Mumbai', value='tab-7',style=tab_style, selected_style=tab_selected_style),
        dcc.Tab(label='Pune', value='tab-8',style=tab_style, selected_style=tab_selected_style),
        dcc.Tab(label='NCR', value='tab-9',style=tab_style, selected_style=tab_selected_style)
    ]),
    html.Div(id='tabs-example-content'),
    html.Div(id='footnote', style={'text-align': 'right', 'font-size':14, 'color': 'black', 'font-family': 'cursive'})
])

@app.callback(Output('tabs-example-content', 'children'),
              Output('footnote', 'children'),
              Input('tabs-example', 'value'),
              prevent_intial_call=True)

def render_content(tab):
    if tab == 'tab-1':
        return  html.Div([
            dcc.Graph(id='g2', figure=india)],
            className="row",
            style={"display": "block","margin-left": "auto","margin-right": "auto"}), "Data Source: housing.com"
    elif tab == 'tab-2':
        return html.Div([
            dcc.Graph(id='g2', figure=ahm)],
            className="row",
            style={"display": "block","margin-left": "auto","margin-right": "auto"}), "Data Source: housing.com"
    elif tab == 'tab-3':
        return html.Div([
            dcc.Graph(id='g2', figure=blr)],
            className="row",
            style={"display": "block","margin-left": "auto","margin-right": "auto"}), "Data Source: housing.com"

    elif tab == 'tab-4':
        return html.Div([
            dcc.Graph(id='g2', figure=che)],
            className="row",
            style={"display": "block","margin-left": "auto","margin-right": "auto"}), "Data Source: housing.com"

    elif tab == 'tab-5':
        return html.Div([
            dcc.Graph(id='g2', figure=hyd)],
            className="row",
            style={"display": "block","margin-left": "auto","margin-right": "auto"}), "Data Source: housing.com"

    elif tab == 'tab-6':
        return html.Div([
            dcc.Graph(id='g2', figure=kol)],
            className="row",
            style={"display": "block","margin-left": "auto","margin-right": "auto"}), "Data Source: housing.com"

    elif tab == 'tab-7':
        return html.Div([
            dcc.Graph(id='g2', figure=mum)],
            className="row",
            style={"display": "block","margin-left": "auto","margin-right": "auto"}), "Data Source: housing.com"

    elif tab == 'tab-8':
        return html.Div([
            dcc.Graph(id='g2', figure=pune)],
            className="row",
            style={"display": "block","margin-left": "auto","margin-right": "auto"}), "Data Source: housing.com"

    elif tab == 'tab-9':
        return html.Div([
            dcc.Graph(id='g2', figure=ncr)],
            className="row",
            style={"display": "block","margin-left": "auto","margin-right": "auto"}), "Data Source: housing.com"

if __name__ == '__main__':
    app.run_server(debug=True, use_reloader=False)
dash app output:
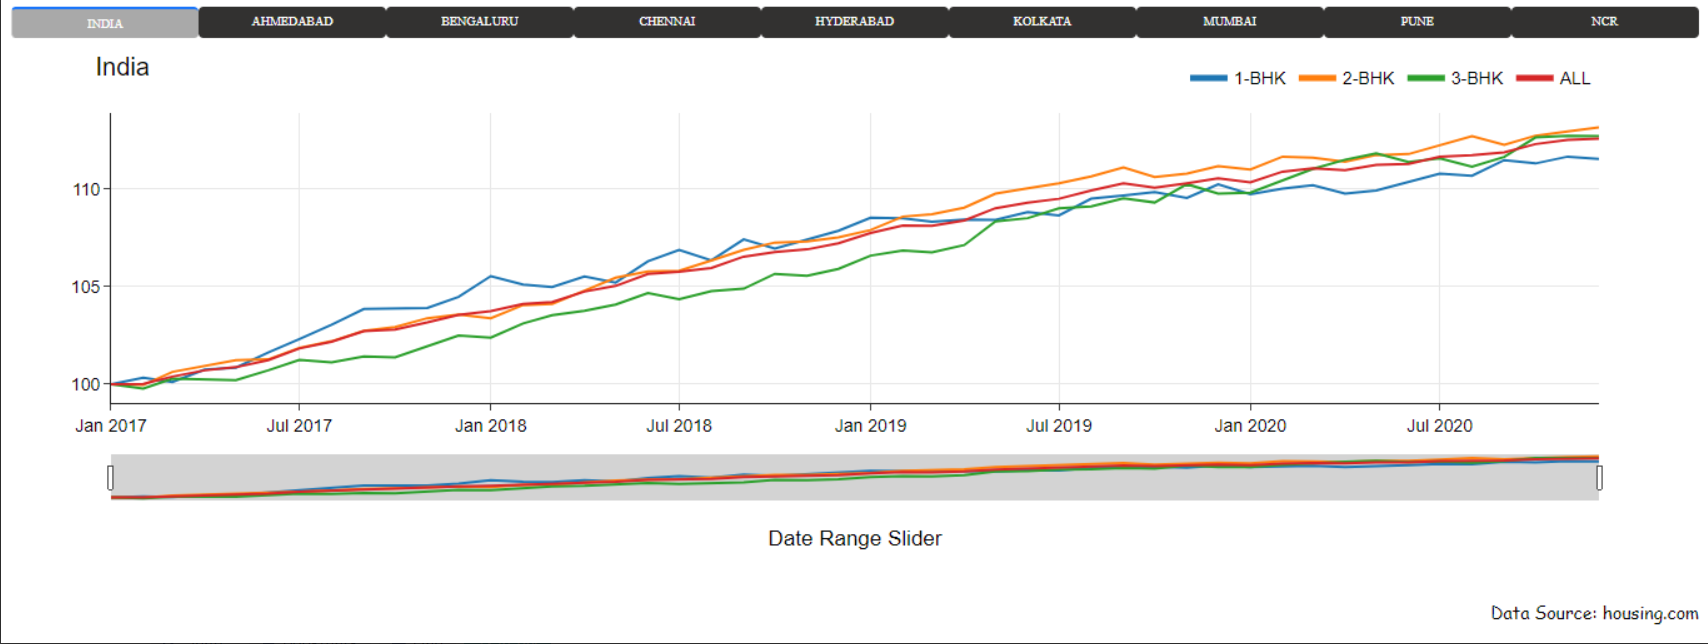
you can clearly see that the logo was successfully added in the plotly image, but it disappeared when I loaded that plot into dash.
Contributor guide
First steps
- Read the whole issue, then the project's contributing guide.
- Comment on the issue to say you are picking it up — it saves two people doing the same work.
- Fork the repository and make your change on a branch.
- Open a pull request that references the issue number.
Research direction
Start by reproducing the difference between fig.show() and the dcc.Graph rendering in the supplied Dash code, using the image source "housing_black.jpg". Trace how the figure's layout images are transferred and resolved in Dash, then confirm the logo appears when the graph is loaded through the tab callback.
Written by the indexing model from the issue text.
Assessment
- Tech stack
- python
- Domain
- data-visualization
- Issue type
- Bug
- Difficulty
- 3/5
- Estimated time
- 1-2 days
- Activity status
- Stale
- Clarity
- Needs clarification
- Newbie friendliness
- 35/100