Show tiflash-server information in the cluster Overview panel
Open
Nobody has claimed this yet.
help wanted
type/enhancement
- Dominant language
- C++
- Stars
- 1k
- Forks
- 423
- Avg merge
- 1d 15h
- Merged PRs (30d)
- 24
Description
Enhancement
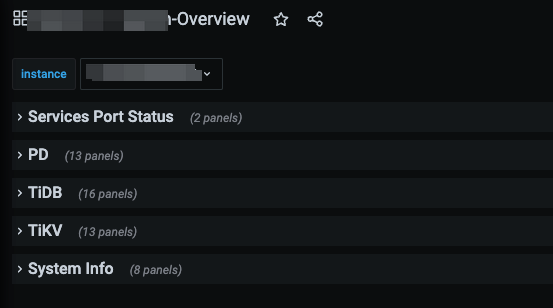
After deploying a tidb cluster by TiUP, there is an "Overview" panel in Grafana. But it does not show the information about tiflash-servers.
The json definition file is maintained in tidb repo: https://github.com/pingcap/tidb/blob/master/metrics/grafana/overview.json
Contributor guide
No contributing guide indexed for this repository
First steps
- Read the whole issue, then the project's contributing guide.
- Comment on the issue to say you are picking it up — it saves two people doing the same work.
- Fork the repository and make your change on a branch.
- Open a pull request that references the issue number.
Research direction
Open tidb's metrics/grafana/overview.json and inspect how the Grafana Overview panel defines server information. Compare the existing cluster entries with the available tiflash-server metrics, then verify that the Overview panel displays tiflash-server information after the dashboard definition is updated.
Written by the indexing model from the issue text.
Assessment
- Tech stack
- grafana
- Domain
- observability
- Issue type
- Feature
- Difficulty
- 2/5
- Estimated time
- 1-3 hours
- Activity status
- Stale
- Clarity
- Mostly clear
- Newbie friendliness
- 45/100