Simplifying TiDB Statistics Collection: Unifying Concurrency Controls
- Dominant language
- Go
- Stars
- 40.5k
- Forks
- 6.2k
- PR merge metrics
- PR metrics pending
Description
# Background
TiDB provides the `analyze table table_name` command to generate statistics for tables. When analyzing partitioned tables, TiDB processes each partition independently and in parallel. Once analysis completes, TiDB aggregates the individual partition statistics into a single global statistics object for the entire table.
The `analyze table` command has two concurrency-related parameters:
- `tidb_build_stats_concurrency`: Determines how many partitions can be processed simultaneously during statistics collection
- `tidb_analyze_partition_concurrency`: Controls parallel workers for saving partition statistics
However, these parameters have several drawbacks:
- The name `tidb_build_stats_concurrency` is imprecise - it actually governs parallel processing of partitions/tables rather than statistics building itself
- Having two separate concurrency controls is unnecessarily complex and makes it difficult for users to understand and predict the performance impact of their settings
In this blog post, we will discuss the issues with the current parameters and propose a solution to merge them into one.
# Test Result
## Small Partition Table
To evaluate the performance impact of these parameters, I benchmarked an `analyze table` command on a partitioned table containing 100 partitions and 30 million rows. Here are the results:
> **Note:** Test environment: 3 TiKV nodes and 3 TiDB nodes, each with 16 cores and 32GB RAM.
| `tidb_build_stats_concurrency` | `tidb_analyze_partition_concurrency` | `analyze table` Time |
|--------------------------------|--------------------------------------|----------------------|
| 2 | 2 | 6 min 8.61 sec |
| 15 | 2 | 2 min 55.71 sec |
| 2 | 15 | 6 min 4.41 sec |
| 15 | 15 | 2 min 26.63 sec |
The benchmark results clearly show that `tidb_build_stats_concurrency` has a much larger impact on overall execution time than `tidb_analyze_partition_concurrency`.
This makes sense given the small partition sizes (300k rows per partition) - analyzing each partition completes quickly and generates minimal statistics data to save. As a result, the parallel statistics saving controlled by `tidb_analyze_partition_concurrency` isn't a performance bottleneck, explaining its minimal impact on total execution time.
The following sections will prove this point by showing the `analyze_jobs` table.
## Analysis
Before we dive into the details, let's first take a look at the analysis model of TiDB.
### Collection Phase
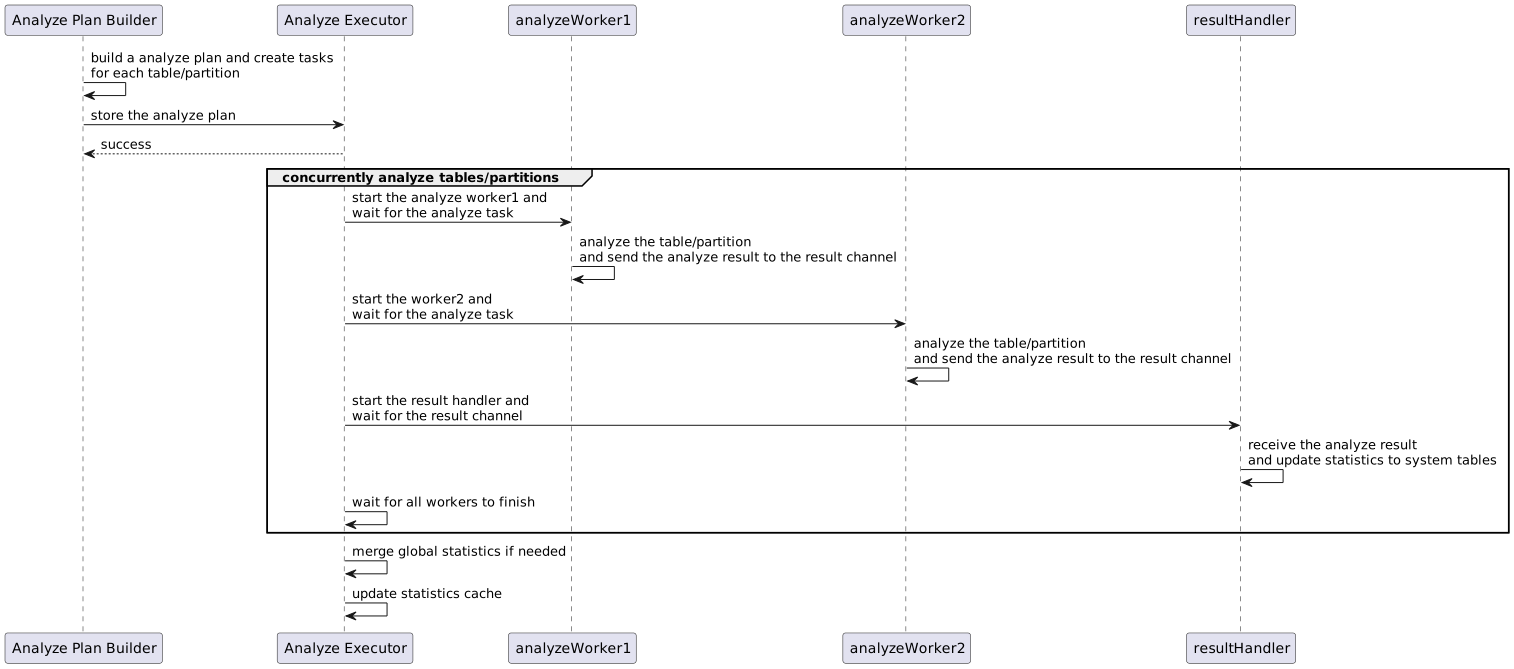
Here's how TiDB's analyze workflow works:
1. The Analyze Plan Builder splits the work into tasks by table/partition
2. Multiple analyze workers run these tasks in parallel
3. Each worker:
- Processes its assigned data independently
- Streams results back to a central handler
- Updates system tables with statistics as it goes
4. After all workers finish:
- Global statistics are merged if needed
- The statistics cache gets refreshed
This parallel architecture enables efficient and reliable statistics collection across the TiDB cluster. The `tidb_build_stats_concurrency` parameter plays a crucial role here by determining how many analyze workers can run simultaneously, directly impacting the throughput of partition processing.
### Persistence Phase
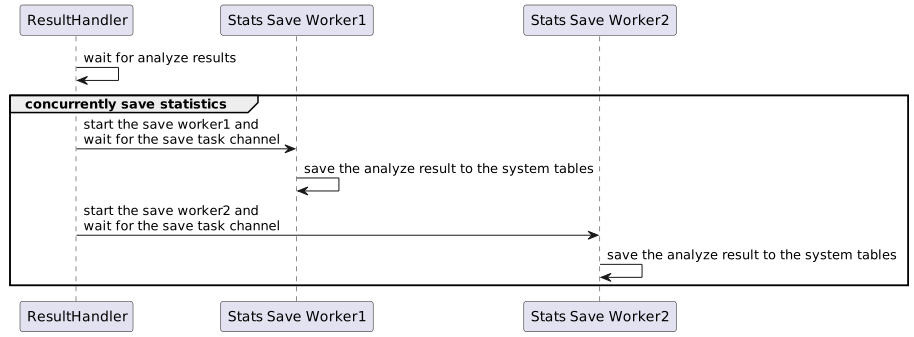
Once data collection completes, TiDB enters the persistence phase. During this phase, the system writes the collected statistics to some system tables: `mysql.stats_meta`, `mysql.stats_buckets`, etc. The `tidb_analyze_partition_concurrency` parameter determines how many concurrent workers handle these write operations.
These parameters have different but related roles. The system follows a producer-consumer pattern, with `tidb_build_stats_concurrency` as the producer controlling statistics collection, and `tidb_analyze_partition_concurrency` as the consumer managing persistence. This design means their relative impact on performance can vary significantly depending on the specific workload characteristics.
Now that we understand both phases, let's dive into the execution details of the `analyze table` command to see how it works in practice.
TiDB records the execution details of the `analyze table` command in the `mysql.analyze_jobs` table. The following is an example of the `analyze_jobs` table:
```sql
SELECT table_schema,
table_name,
partition_name,
job_info,
processed_rows,
start_time,
end_time,
state
FROM mysql.analyze_jobs
LIMIT 3;
+------------+----------+--------------+-------------------------------------------------------------------------------------------------------------+--------------+-------------------+-------------------+--------+
|table_schema|table_name|partition_name|job_info |processed_rows|start_time |end_time |state |
+------------+----------+--------------+-------------------------------------------------------------------------------------------------------------+--------------+-------------------+-------------------+--------+
|test |test_table|p18 |auto analyze table all indexes, columns id, part_id with 256 buckets, 100 topn, 1 samplerate |413000 |2024-11-18 15:53:04|2024-11-18 15:53:05|finished|
|test |test_table|p6 |auto analyze table all indexes, columns id, part_id with 256 buckets, 100 topn, 0.2722772277227723 samplerate|425000 |2024-11-18 15:53:05|2024-11-18 15:53:06|finished|
|test |test_table|p0 |auto analyze table all indexes, columns id, part_id with 256 buckets, 100 topn, 0.2736318407960199 samplerate|434000 |2024-11-18 15:53:05|2024-11-18 15:53:06|finished|
+------------+----------+--------------+-------------------------------------------------------------------------------------------------------------+--------------+-------------------+-------------------+--------+
```
Let's analyze the overall timeline from when statistics collection begins to when the data is persisted to storage. This will give us insight into both the collection and persistence phases of the operation.
| `tidb_build_stats_concurrency` | `tidb_analyze_partition_concurrency` | partition | Start Time | End Time |
|--------------------------------|--------------------------------------|-----------|---------------------|---------------------|
| 2 | 2 | p18 | 2024-11-22 11:31:27 | 2024-11-22 11:31:36 |
| 15 | 2 | p18 | 2024-11-22 12:37:35 | 2024-11-22 12:38:14 |
Examining the `start_time` and `end_time` columns reveals that individual partition processing times remain consistent across different parameter configurations, with all partitions completing within a 10-second window. This consistent timing indicates that the overall performance differences we observed cannot be explained by variations in how long it takes to process each partition.
However, examining the number of concurrent partition operations reveals that `tidb_build_stats_concurrency` directly controls the degree of parallelism in partition processing.
```sql
SELECT COUNT(*) AS record_count
FROM mysql.analyze_jobs
WHERE start_time BETWEEN '2024-11-22 11:31:00' AND '2024-11-22 11:31:59';
```
| `tidb_build_stats_concurrency` | `tidb_analyze_partition_concurrency` | record_count |
|--------------------------------|--------------------------------------|--------------|
| 2 | 2 | 20 |
| 15 | 2 | 29 |
The analysis reveals that increasing `tidb_build_stats_concurrency` enables more partitions to be processed concurrently. Since statistics persistence is not a performance bottleneck, this higher degree of partition-level parallelism directly translates to faster overall statistics collection.
This finding explains the significant performance impact of `tidb_build_stats_concurrency` compared to the relatively minor effect of `tidb_analyze_partition_concurrency`.
## Large Partition Table
I also tested the `analyze table` command on a partitioned table containing 100 partitions and 2 billion rows. The results are as follows:
> **Note:** Test environment: 3 TiKV nodes and 3 TiDB nodes, each with 16 cores and 32GB RAM. Same as the previous test.
| `tidb_build_stats_concurrency` | `tidb_analyze_partition_concurrency` | `analyze table` Time |
|--------------------------------|--------------------------------------|----------------------|
| 2 | 2 | 25 min 39.67 sec |
| 15 | 2 | 10 min 58.74 sec |
| 2 | 15 | 24 min 15.95 sec |
| 15 | 15 | 9 min 4.36 sec |
The results from this large-scale test validate our earlier findings - increasing `tidb_build_stats_concurrency` provides significant performance improvements, while `tidb_analyze_partition_concurrency` has a relatively minor impact on overall execution time.
While our initial findings suggest that `tidb_build_stats_concurrency` is the dominant factor in performance optimization, let's examine a different scenario to validate this hypothesis.
## Wide Table
I tested the `analyze table` command on a wide table containing 500 partitions and 200 columns and 3 million rows. Here are the results:
| `tidb_build_stats_concurrency` | `tidb_analyze_partition_concurrency` | `analyze table` Time |
|--------------------------------|--------------------------------------|-------------------------|
| 2 | 2 | 1 hour 17 min 57.55 sec |
| 15 | 2 | 1 hour 15 min 30.46 sec |
| 2 | 15 | 34 min 31.38 sec |
| 15 | 15 | 34 min 56.99 sec |
The execution time is influenced by both parameters, with `tidb_analyze_partition_concurrency` having a more significant impact compared to the small partition table test. This is because the increased number of columns creates a bottleneck during the statistics persistence phase.
These settings are hard to tune correctly. Optimal configuration requires deep understanding of both the collection and persistence phases for your specific workload. Additionally, since these parameters are cluster-wide settings rather than table-specific, finding ideal values that work well across different table schemas becomes challenging.
## Conclusion
From our tests, we can see that adjusting these two parameters is actually quite challenging. While `tidb_build_stats_concurrency` dominates performance for partitioned tables, our wide table test shows that `tidb_analyze_partition_concurrency` can have a more significant impact in certain scenarios. To simplify configuration, I recommend merging these parameters. Since `tidb_analyze_partition_concurrency` better describes the overall functionality of controlling parallelism during statistics collection, we should keep this parameter and deprecate `tidb_build_stats_concurrency`. This will make tuning more straightforward while still providing the necessary control over concurrency for different table types.
Contributor guide
Assessment
This issue has not been assessed yet.