metric: distinguish internal or external types for the transaction grafana panels
- Dominant language
- Go
- Stars
- 40.5k
- Forks
- 6.2k
- PR merge metrics
- PR metrics pending
Description
## Feature Request
**Is your feature request related to a problem? Please describe:**
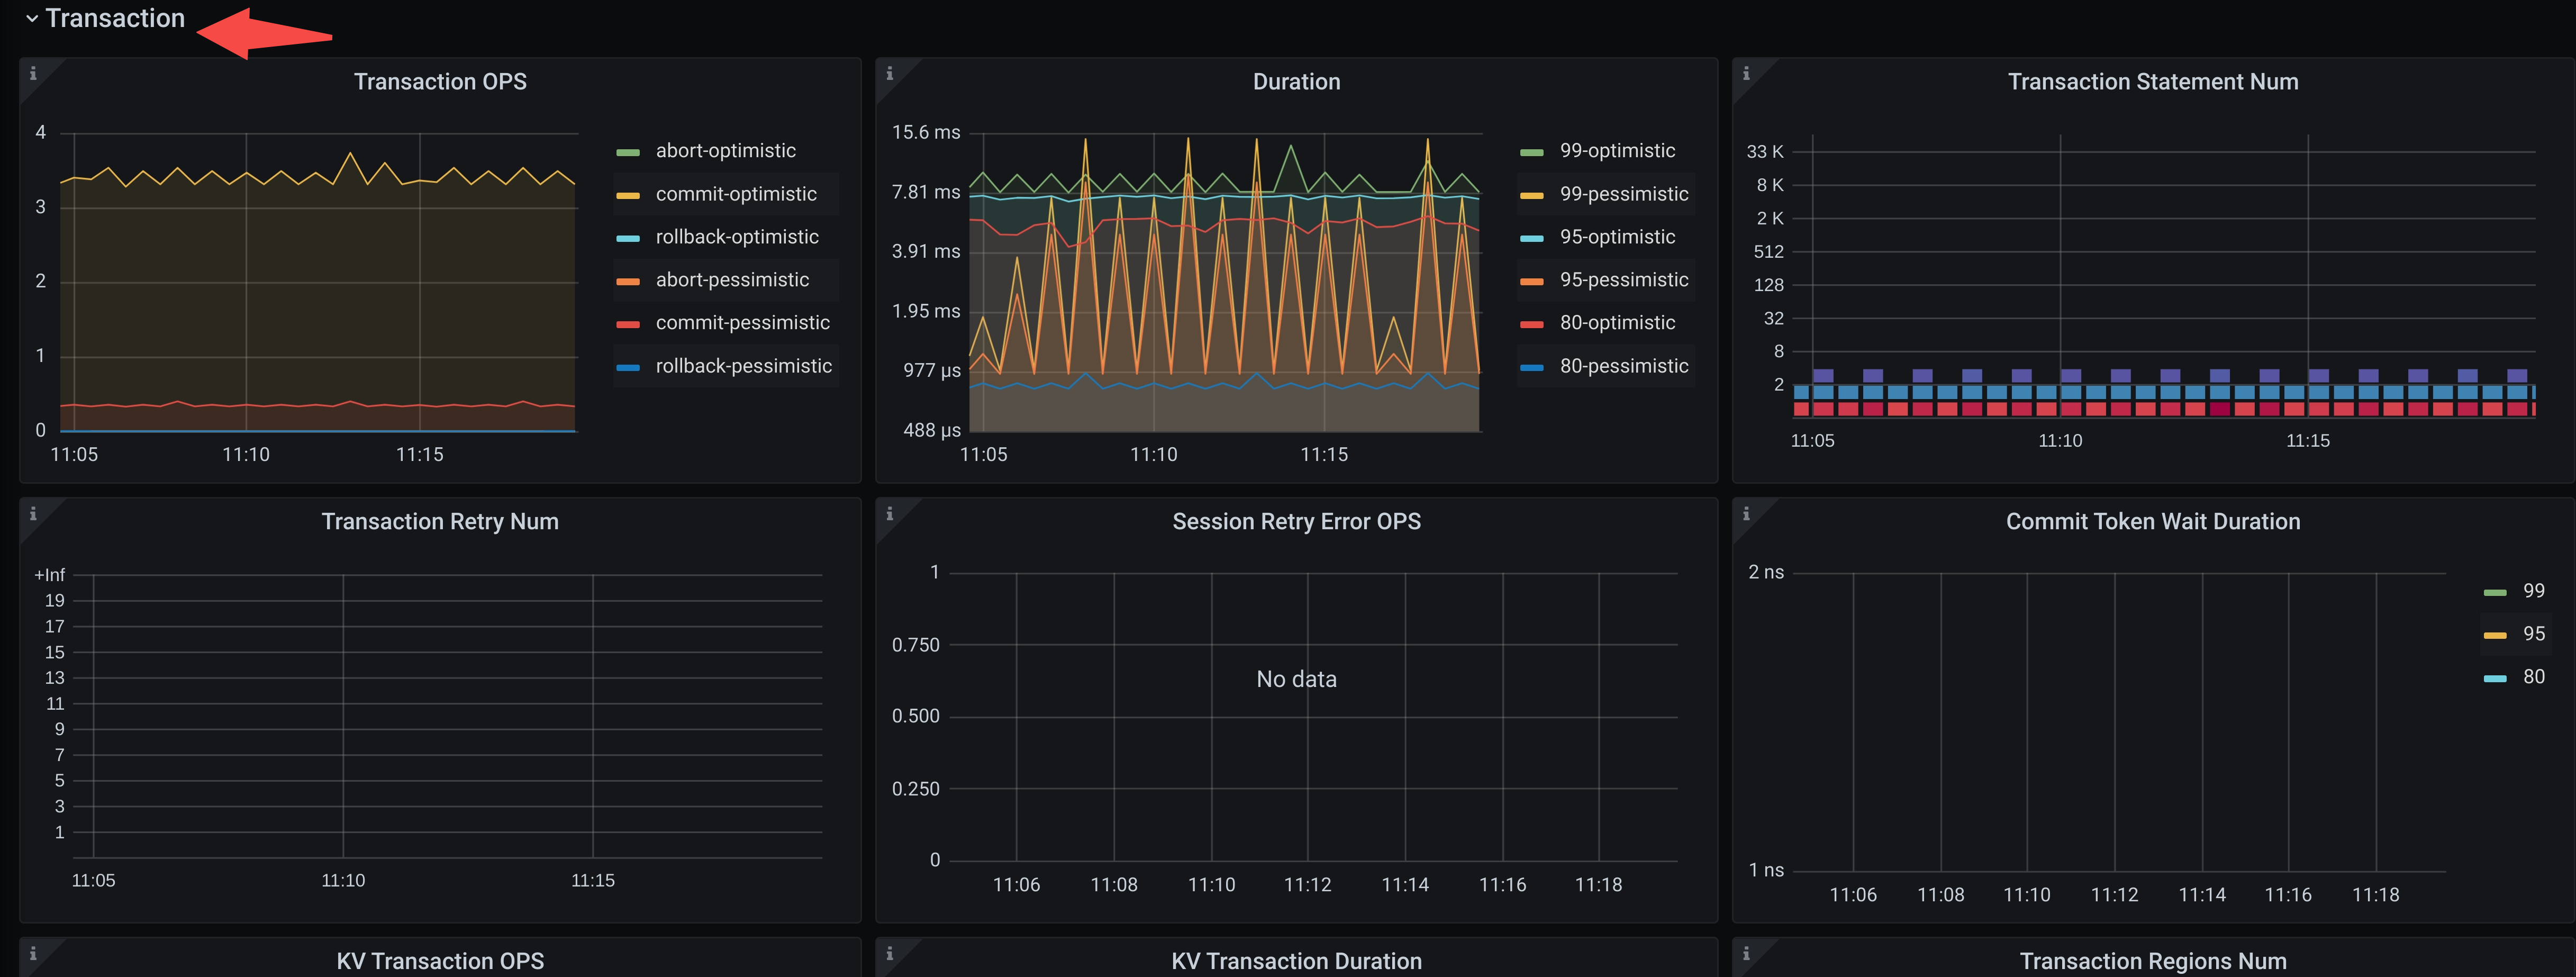
The [metric](https://github.com/pingcap/tidb/blob/master/session/txninfo/txn_info.go#L50) is used by both internal and external transactions. So are the other transaction metrics.
In the previous version, a [context information](https://github.com/pingcap/tidb/blob/master/kv/option.go#L91) is already added
**Describe the feature you'd like:**
Distinguish the transaction types, display the external transaction metrics on the grafana page.
**Describe alternatives you've considered:**
Add a dimension for the transaction types. Improve the diagnosis for the following issues:
- In transaction idle.
- In transaction idle holding pessimistic locks.
- Non-active connections.
**Teachability, Documentation, Adoption, Migration Strategy:**
Contributor guide
Research direction
Start by reading session/txninfo/txn_info.go and kv/option.go, then locate the transaction Grafana panels and their metric definitions. Determine how internal and external transaction types can be represented as a metric dimension; done means the external transaction metrics are displayed and the listed idle and non-active connection diagnoses are improved.
Written by the indexing model from the issue text.
Assessment
- Tech stack
- go, grafana
- Domain
- databases, observability
- Issue type
- Feature
- Difficulty
- 4/5
- Estimated time
- 3-5 days
- Activity status
- Stale
- Clarity
- Needs clarification
- Newbie friendliness
- 30/100