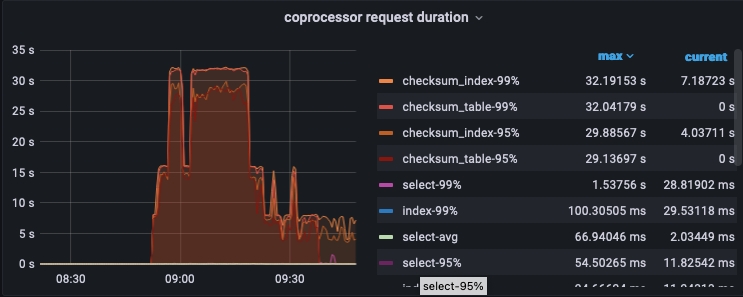
Some select queries would be executed with a long time in the stage of backup-checksum
- Dominant language
- Go
- Stars
- 40.5k
- Forks
- 6.2k
- PR merge metrics
- PR metrics pending
Description
- What version of TiDB are you using?
tidb_version(): Release Version: v5.3.0
Edition: Community
Git Commit Hash: 4a1b2e9fe5b5afb1068c56de47adb07098d768d6
Git Branch: heads/refs/tags/v5.3.0
UTC Build Time: 2021-11-24 13:32:39
GoVersion: go1.16.4
Race Enabled: false
TiKV Min Version: v3.0.0-60965b006877ca7234adaced7890d7b029ed1306
Check Table Before Drop: false
- What's the observed and your expected performance respectively?
There would be some select queries which were executed with a long time until timeout in the stage of backup-checksum every day. However, these queries can be run successfully with several ms in other time. I expect these queries can be run fast as normal.
- Have you compared TiDB with other databases? If yes, what's their difference?
It can be run fast in mysql.
- For a specific slow SQL query, please provide the following information:
- Whether this SQL query always or occasionally runs slowly.
This query runs slowly occasionally and always occur in the stage of backup-checksum.
- Table schema
```
CREATE TABLE `pink_attach_55555` (
`id` bigint(20) unsigned NOT NULL AUTO_INCREMENT COMMENT '',
`item_id` bigint(20) unsigned NOT NULL DEFAULT '0' COMMENT '',
`access_key` varchar(50) COLLATE utf8mb4_general_ci NOT NULL DEFAULT '' COMMENT '',
`file_name` varchar(50) COLLATE utf8mb4_general_ci NOT NULL DEFAULT '' COMMENT '',
`file_location` varchar(200) COLLATE utf8mb4_general_ci NOT NULL DEFAULT '' COMMENT '',
`file_type` tinyint(4) unsigned NOT NULL DEFAULT '1' COMMENT '',
`status` tinyint(2) unsigned NOT NULL DEFAULT '1' COMMENT '',
`create_time` timestamp NOT NULL DEFAULT CURRENT_TIMESTAMP COMMENT '',
`modify_time` timestamp NOT NULL DEFAULT CURRENT_TIMESTAMP ON UPDATE CURRENT_TIMESTAMP COMMENT '',
`type` tinyint(2) NOT NULL DEFAULT '0' COMMENT '',
`source_id` bigint(20) NOT NULL DEFAULT '0' COMMENT '',
PRIMARY KEY (`id`) /*T![clustered_index] CLUSTERED */,
KEY `idx_item_id` (`item_id`)
) ENGINE=InnoDB DEFAULT CHARSET=utf8mb4 COLLATE=utf8mb4_general_ci AUTO_INCREMENT=29092865 COMMENT=''
```
- Explain SQL plan
```
id task estRows operator info actRows execution info memory disk
Projection_4 root 1.88 hupu_du_pink.pink_attach_55555.id, hupu_du_pink.pink_attach_55555.item_id, hupu_du_pink.pink_attach_55555.access_key, hupu_du_pink.pink_attach_55555.file_name, hupu_du_pink.pink_attach_55555.file_location, hupu_du_pink.pink_attach_55555.file_type, hupu_du_pink.pink_attach_55555.type, hupu_du_pink.pink_attach_55555.status, hupu_du_pink.pink_attach_55555.create_time, hupu_du_pink.pink_attach_55555.modify_time, hupu_du_pink.pink_attach_55555.source_id 0 time:10s, loops:1, Concurrency:OFF 4.75 KB N/A
└─IndexLookUp_11 root 1.88 0 time:10s, loops:1, index_task: {total_time: 981µs, fetch_handle: 976.2µs, build: 999ns, wait: 3.75µs}, table_task: {total_time: 10s, num: 1, concurrency: 5} 8 KB N/A
├─IndexRangeScan_8 cop[tikv] 14.70 table:pink_attach_55555, index:idx_item_id(item_id), range:[410158903,410158903], keep order:false 35 time:970.7µs, loops:3, cop_task: {num: 1, max: 918.4µs, proc_keys: 35, rpc_num: 1, rpc_time: 908.8µs, copr_cache_hit_ratio: 0.00}, tikv_task:{time:0s, loops:2}, scan_detail: {total_process_keys: 35, total_process_keys_size: 1610, total_keys: 36, rocksdb: {delete_skipped_count: 0, key_skipped_count: 35, block: {cache_hit_count: 13, read_count: 0, read_byte: 0 Bytes}}} N/A N/A
└─Selection_10 cop[tikv] 1.88 eq(hupu_du_pink.pink_attach_55555.status, 1), in(hupu_du_pink.pink_attach_55555.type, 5, 6, 9) 0 time:10s, loops:1 N/A N/A
└─TableRowIDScan_9 cop[tikv] 14.70 table:pink_attach_55555, keep order:false
```
- TiDB log
```
[2022/08/25 08:56:27.826 +08:00] [INFO] [server.go:659] [kill] [connID=29589949] [query=true]
[2022/08/25 08:56:27.826 +08:00] [ERROR] [distsql.go:1201] ["table reader fetch next chunk failed"] [conn=29589949] [error="[executor:1317]Query execution was interrupted"]
[2022/08/25 08:56:27.826 +08:00] [WARN] [client_batch.go:794] ["wait response is cancelled"] [to=10.xxx.xxx.48:20160] [cause="context canceled"]
[2022/08/25 08:56:27.827 +08:00] [INFO] [conn.go:1069] ["command dispatched failed"] [conn=29589949] [connInfo="id:29589949, addr:10.xxx.xxx.82:47326 status:10, collation:utf8_general_ci, user:hupu_du_pink"] [command=Query] [status="inTxn:0, autocommit:1"] [sql="select\n \n id, item_id, access_key, file_name, file_location, file_type, type, status, create_time, \n modify_time, source_id\n \n FROM pink_attach_55555\n \n WHERE status = 1\n \n and item_id = 410158903\n \n \n \n and type in\n (\n 5\n ,\n 6\n ,\n 9\n )"] [txn_mode=PESSIMISTIC] [err="[executor:1317]Query execution was interrupted"]
```
- grafana
Contributor guide
Assessment
This issue has not been assessed yet.