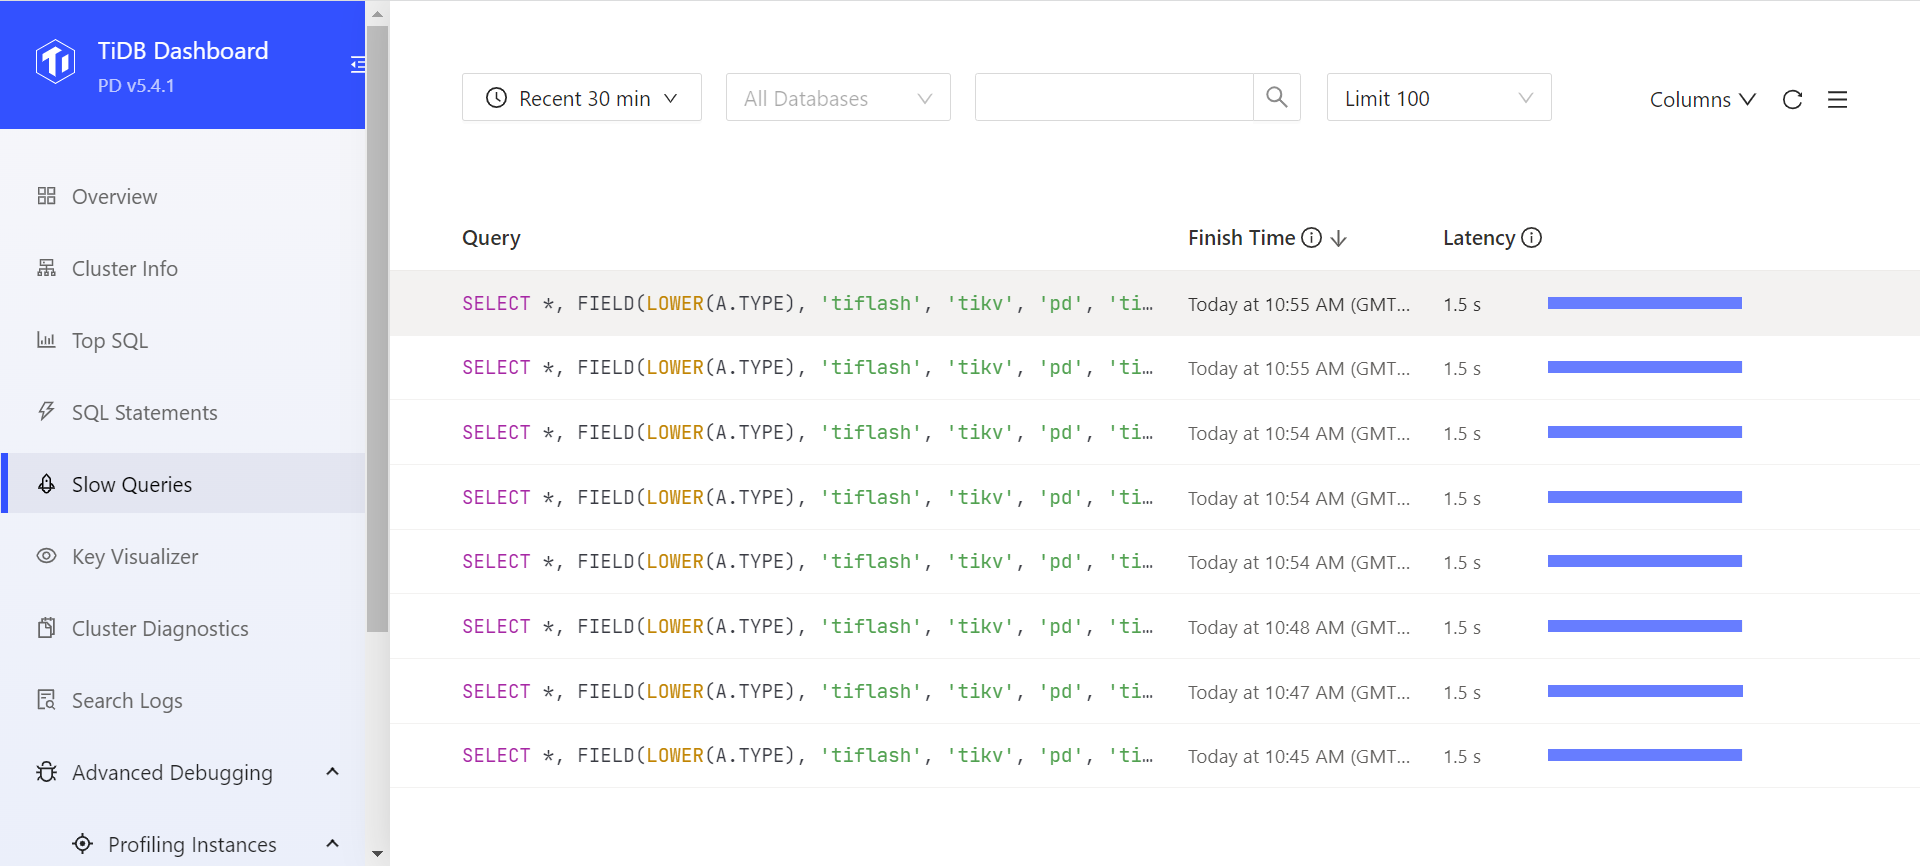
View Cluster Info page always generate slow queries which have a stable query_time of 1.5s
Open
severity/moderate
sig/diagnosis
type/bug
- Dominant language
- Go
- Stars
- 40.5k
- Forks
- 6.2k
- PR merge metrics
- PR metrics pending
Description
## Bug Report
Please answer these questions before submitting your issue. Thanks!
### 1. Minimal reproduce step (Required)
1. Start a new cluster: tiup playground v5.4.1
2. Login and view the dashboard
3. Open Cluster Info - Hosts/Disks/Statistics page
### 2. What did you expect to see? (Required)
These pages should be displayed quickly when there is no workload.
### 3. What did you see instead (Required)
There is a delay of 1.5s and some slow queries are generated. I don't think it's a good user experience.
### 4. What is your TiDB version? (Required)
v5.4.1
Contributor guide
Assessment
This issue has not been assessed yet.