grafana: PD Client CMD Duration not display correctly
- Dominant language
- Go
- Stars
- 40.5k
- Forks
- 6.2k
- PR merge metrics
- PR metrics pending
Description
## Bug Report
Please answer these questions before submitting your issue. Thanks!
### 1. Minimal reproduce step (Required)
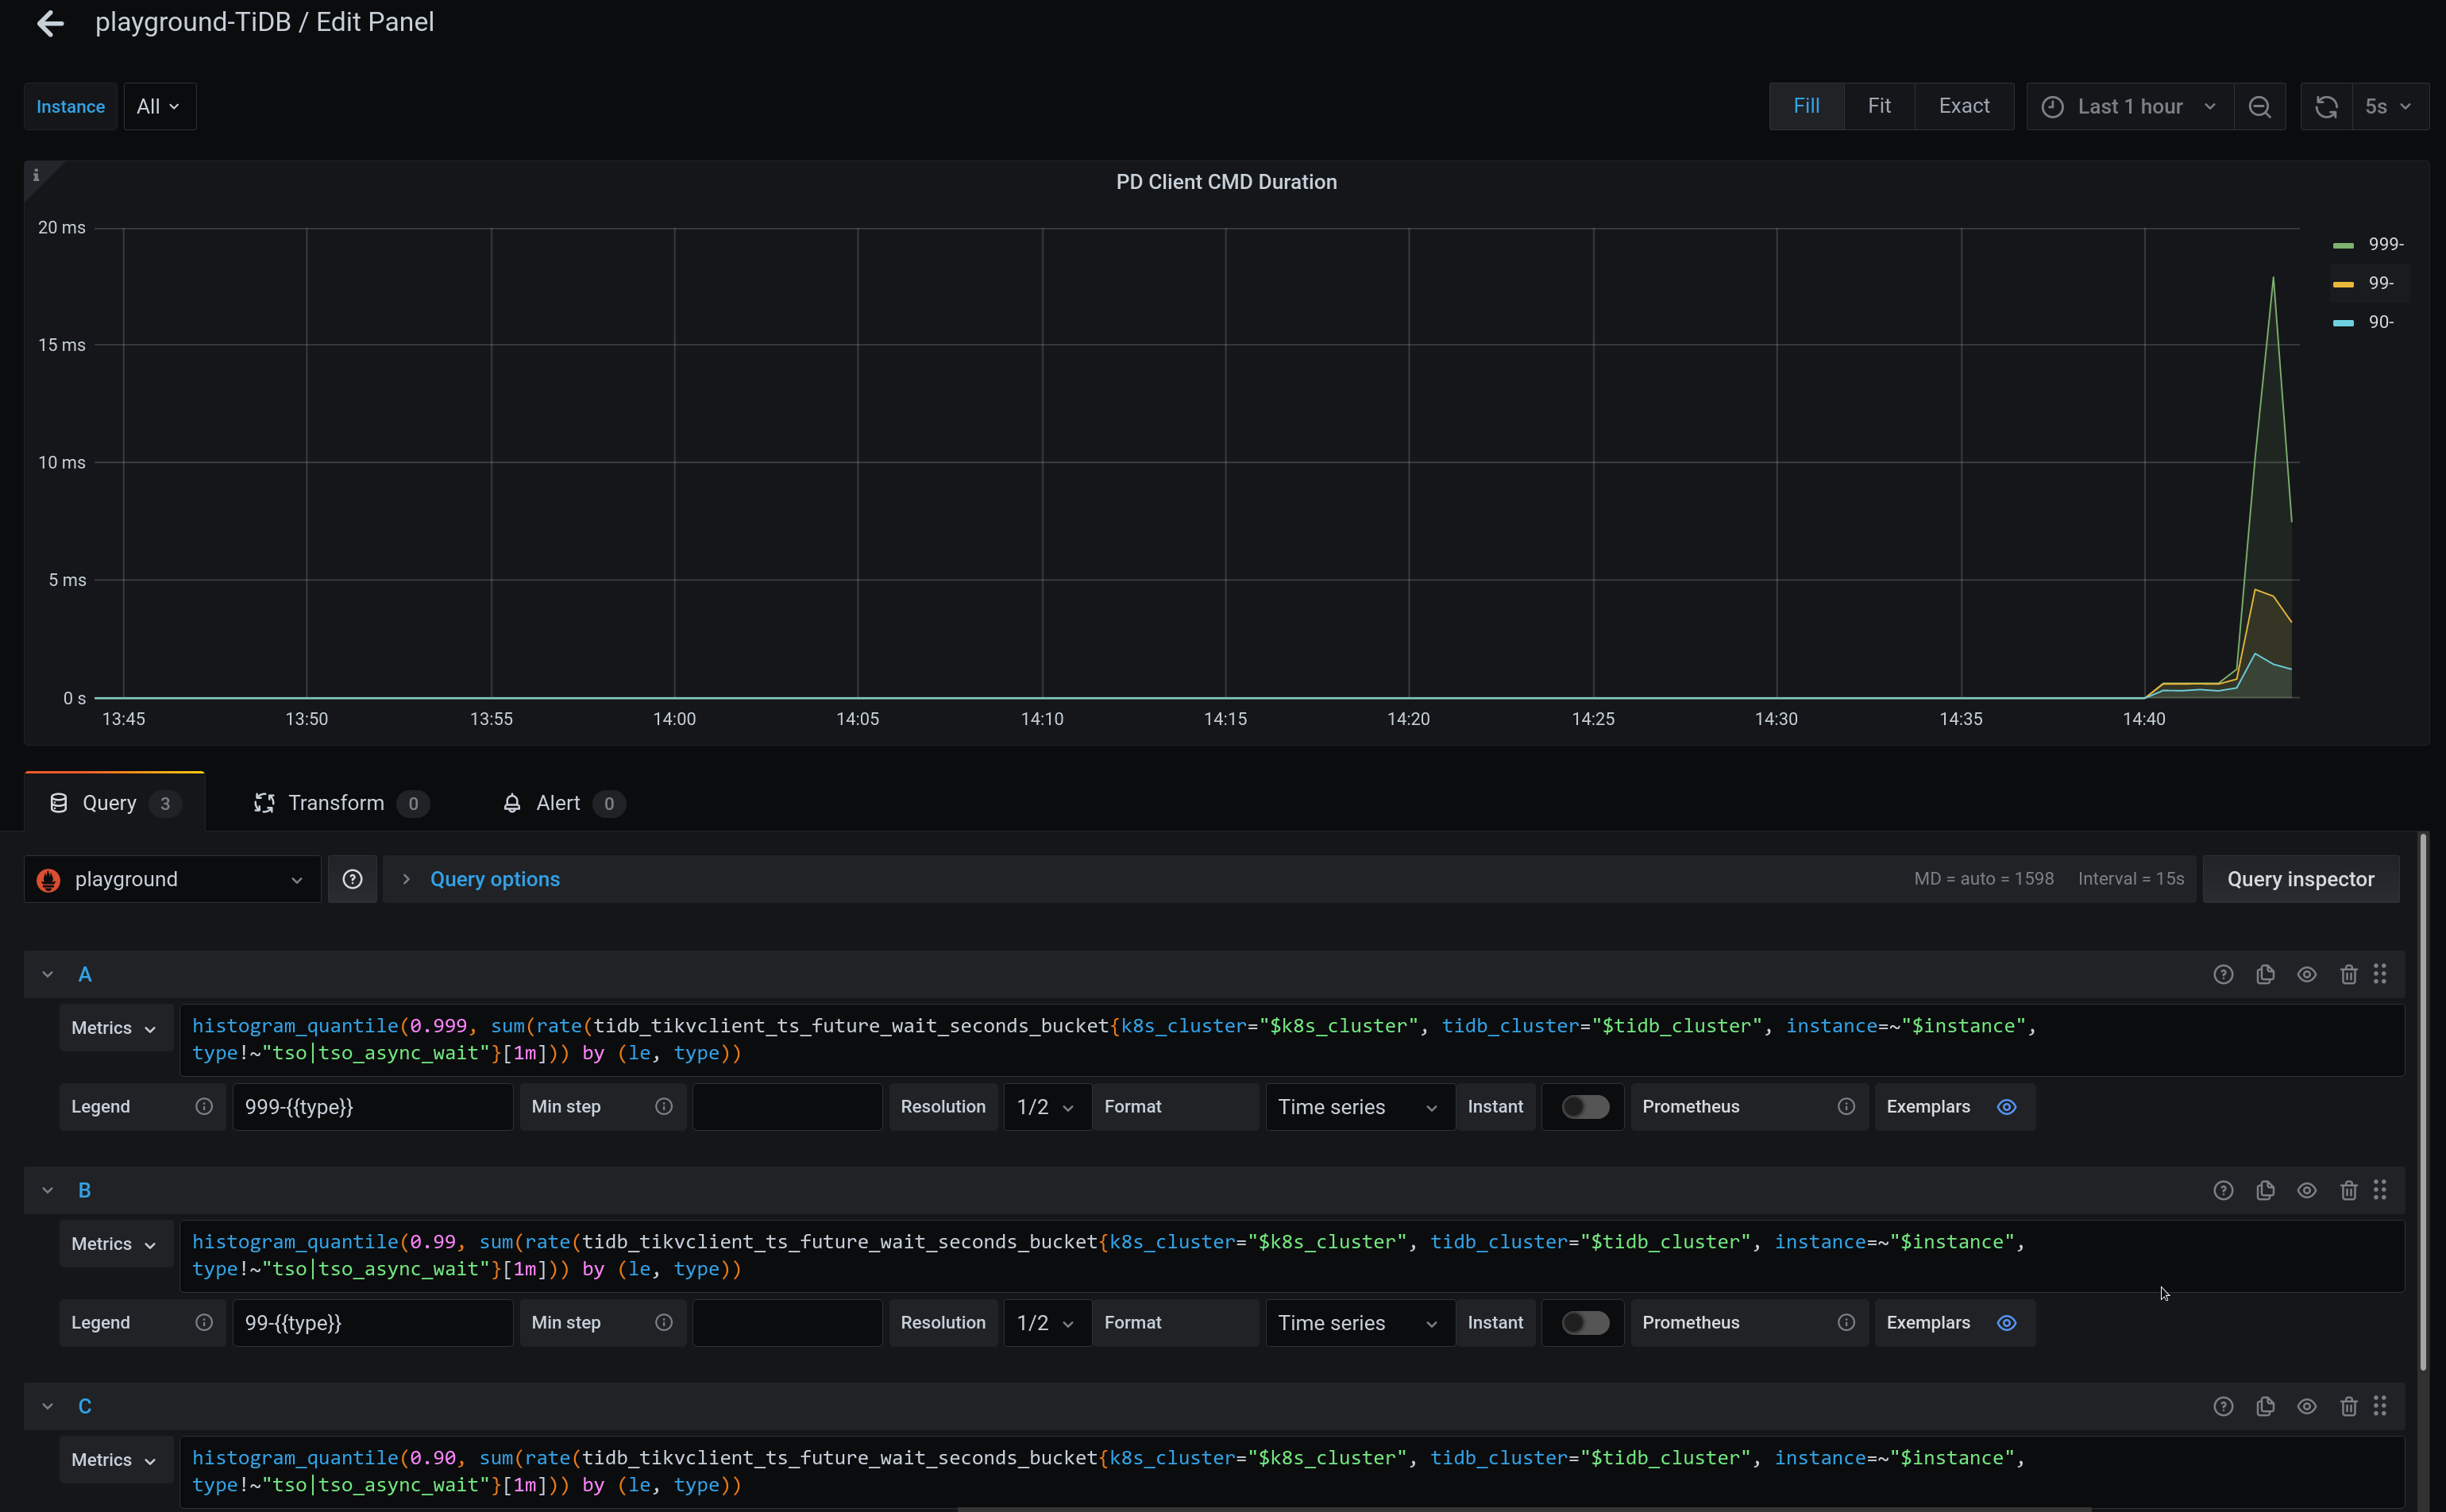
Run playground and check "PD Client - PD Client CMD Duration" panel.
### 2. What did you expect to see? (Required)
The metric is displayed by type.
### 3. What did you see instead (Required)
No types are available and the legends look strange.
### 4. What is your TiDB version? (Required)
```
Release Version: v6.2.0-alpha
Edition: Community
Git Commit Hash: e0527ba27c72b0a533b126fedfa025d47a209ca9
Git Branch: heads/refs/tags/v6.2.0-alpha
UTC Build Time: 2022-06-21 14:31:04
GoVersion: go1.18.2
Race Enabled: false
TiKV Min Version: v3.0.0-60965b006877ca7234adaced7890d7b029ed1306
Check Table Before Drop: false
Store: tikv
```
Contributor guide
Assessment
This issue has not been assessed yet.