opensearch-project / opensearch-project/alerting
[BUG] Alert trigger bug
Nobody has claimed this yet.
- Dominant language
- Kotlin
- Stars
- 82
- Forks
- 133
- Avg merge
- 2d 11h
- Merged PRs (30d)
- 9
Description

Monday Nov 09, 2020 at 10:33 GMT
Originally opened as https://github.com/opendistro-for-elasticsearch/alerting/issues/295
Describe the bug
I created three triggers per monitor through a console program through API.
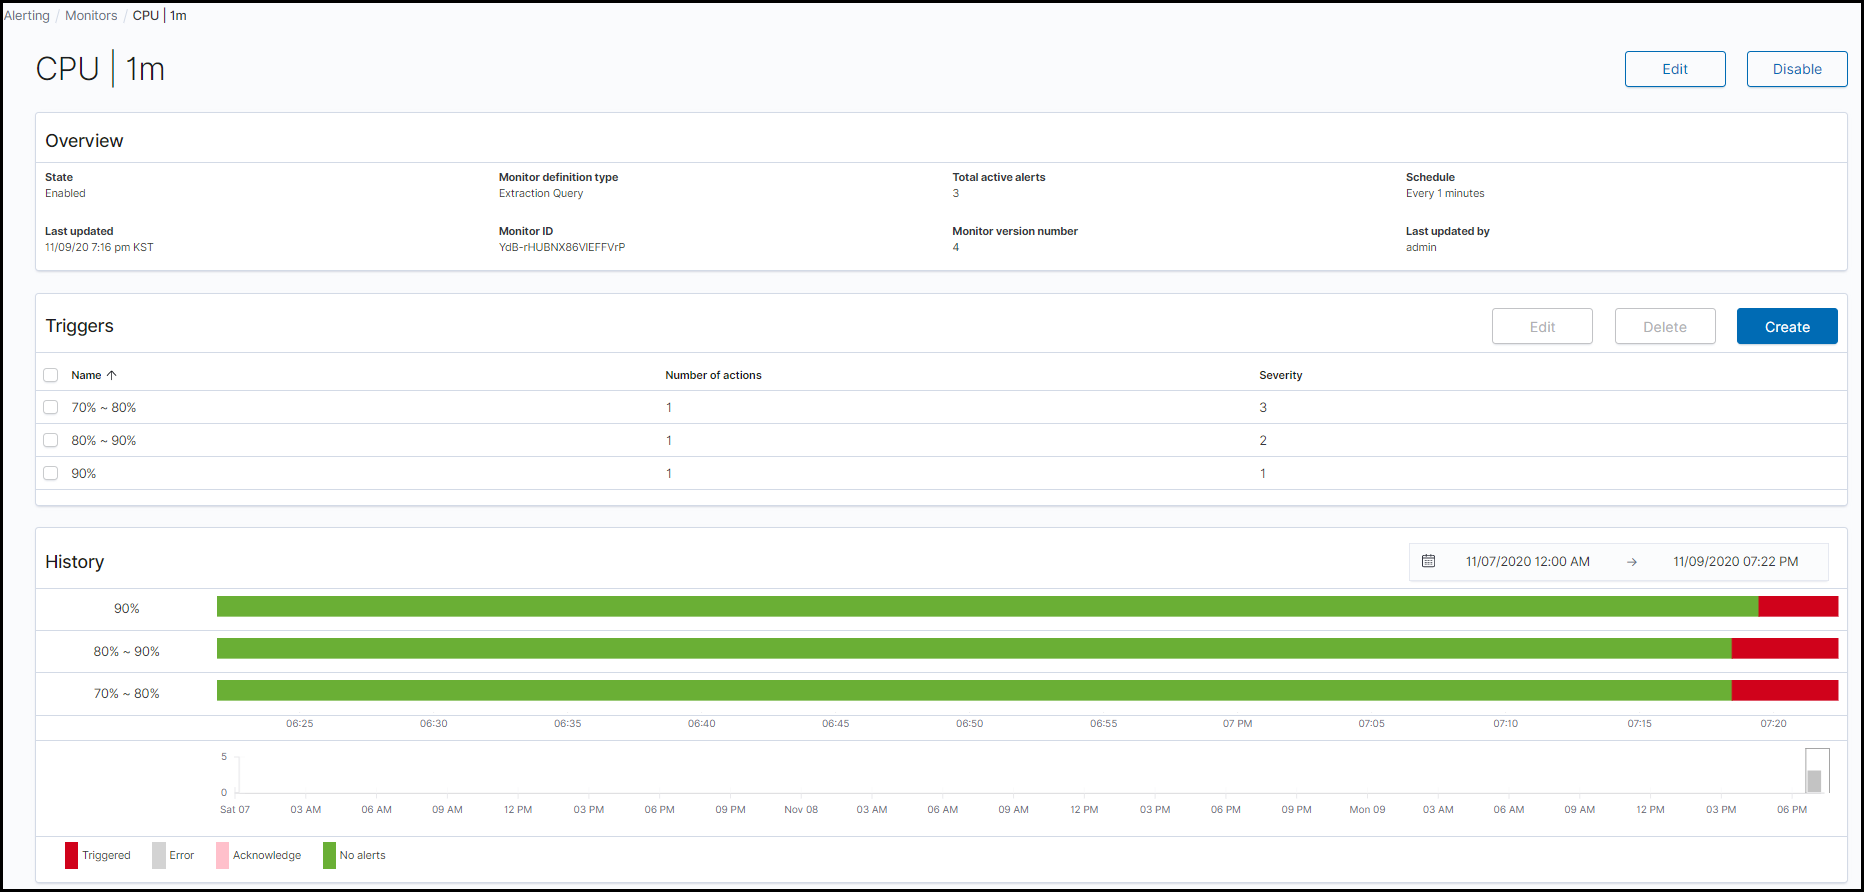
severity 3: CPU 70% to 80%
severity 2: CPU 80% ~ 90%
severity 1: CPU 90%
Although the conditions are all different, if 90% of the triggers trigger the alarm, all the triggers alarm.
Only severity 1 should occur, and severity 2 and severity 3 should not occur.
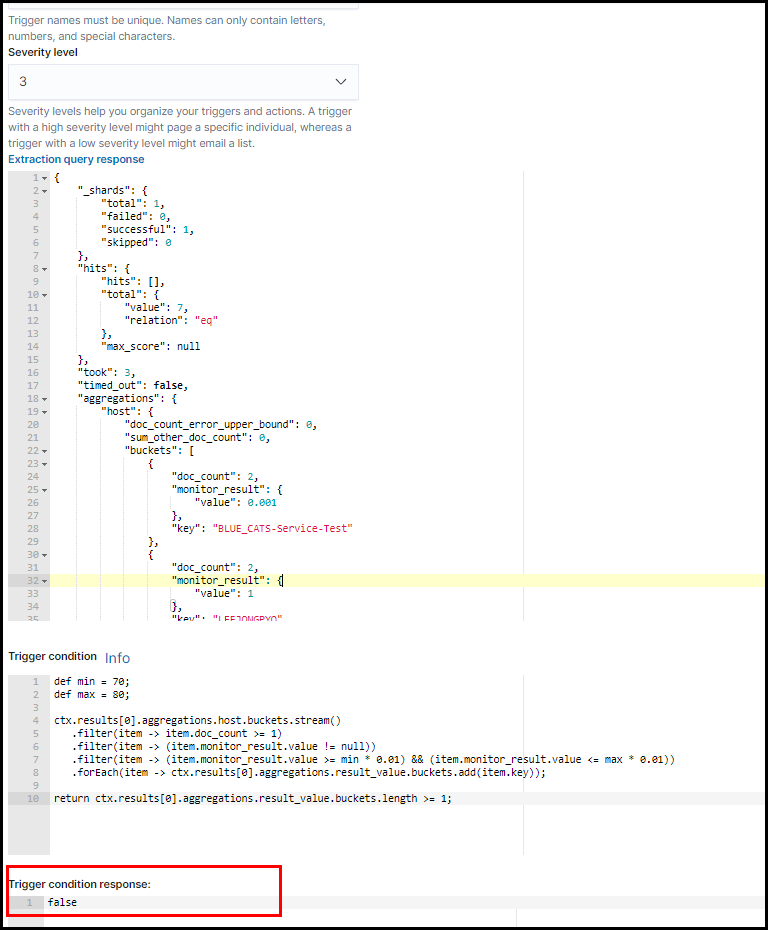
Even if you check the trigger, the result is false, but it is a Triggerd that generates an alarm.
Is this an error, or is there another setting?
monitor, trigger, action
Monitor
{
    "size": 0,
    "query": {
        "bool": {
            "filter": [
                {
                    "range": {
                        "@timestamp": {
                            "from": "{{period_end}}||-1m",
                            "to": "{{period_end}}",
                            "include_lower": true,
                            "include_upper": true,
                            "boost": 1
                        }
                    }
                },
                {
                    "match": {
                        "event.dataset": {
                            "query": "system.cpu",
                            "operator": "OR",
                            "prefix_length": 0,
                            "max_expansions": 50,
                            "fuzzy_transpositions": true,
                            "lenient": false,
                            "zero_terms_query": "NONE",
                            "auto_generate_synonyms_phrase_query": true,
                            "boost": 1
                        }
                    }
                }
            ],
            "adjust_pure_negative": true,
            "boost": 1
        }
    },
    "aggregations": {
        "host": {
            "terms": {
                "field": "host.name.keyword",
                "size": 10,
                "min_doc_count": 1,
                "shard_min_doc_count": 0,
                "show_term_doc_count_error": false,
                "order": [
                    {
                        "_count": "desc"
                    },
                    {
                        "_key": "asc"
                    }
                ]
            },
            "aggregations": {
                "monitor_result": {
                    "max": {
                        "field": "system.cpu.total.norm.pct"
                    }
                }
            }
        },
        "result_value": {
            "terms": {
                "field": "text",
                "size": 10,
                "min_doc_count": 1,
                "shard_min_doc_count": 0,
                "show_term_doc_count_error": false,
                "order": [
                    {
                        "_count": "desc"
                    },
                    {
                        "_key": "asc"
                    }
                ]
            }
        }
    }
}
Trigger : 70% ~ 80% : serverity 3
 def min = 70;
def max = 80;

ctx.results[0].aggregations.host.buckets.stream()
   .filter(item -> item.doc_count >= 1)
   .filter(item -> (item.monitor_result.value != null))
   .filter(item -> (item.monitor_result.value >= min * 0.01) && (item.monitor_result.value <= max * 0.01))
   .forEach(item -> ctx.results[0].aggregations.result_value.buckets.add(item.key));

return ctx.results[0].aggregations.result_value.buckets.length >= 1;
Trigger : 80% ~ 90% : serverity 2
def min = 80;
def max = 90;

ctx.results[0].aggregations.host.buckets.stream()
   .filter(item -> item.doc_count >= 1)
   .filter(item -> (item.monitor_result.value != null))
   .filter(item -> (item.monitor_result.value >= min * 0.01) && (item.monitor_result.value <= max * 0.01))
   .forEach(item -> ctx.results[0].aggregations.result_value.buckets.add(item.key));

return ctx.results[0].aggregations.result_value.buckets.length >= 1;
Trigger : 90% : serverity 1
def min = 90;
def max = 0;

ctx.results[0].aggregations.host.buckets.stream()
   .filter(item -> item.doc_count >= 1)
   .filter(item -> (item.monitor_result.value != null))
   .filter(item -> (item.monitor_result.value >= min * 0.01))
   .forEach(item -> ctx.results[0].aggregations.result_value.buckets.add(item.key));

return ctx.results[0].aggregations.result_value.buckets.length >= 1;
Action
{
  "monitor_name": "{{ctx.monitor.name}}",
  "trigger_name": "{{ctx.trigger.name}}",
  "trigger_id": "{{ctx.trigger.id}}",
  "severity": "{{ctx.trigger.severity}}",
  "period_start": "{{ctx.periodStart}}",
  "period_end": "{{ctx.periodEnd}}",
  "host_name": "{{ctx.results.0.aggregations.result_value.buckets}}"
}
Expected behavior
Only severity 1 should occur, and severity 2 and severity 3 should not occur.
Screenshots
Desktop (please complete the following information):
- OS:
- Server : Ubuntu 18.04
- Client : windows 10
- Browser : Crome, Firefox
- Version :
- Chrome : 86.0.4240.183
- Firefox : 82.0.2 (64-bit)
- Opendistro for Elasticsearch, Kibana: 1.11.0 (Docker)
Contributor guide
First steps
- Read the whole issue, then the project's contributing guide.
- Comment on the issue to say you are picking it up — it saves two people doing the same work.
- Fork the repository and make your change on a branch.
- Open a pull request that references the issue number.
Research direction
Reproduce the alerting behavior using the monitor, three trigger scripts, and action payload shown in the issue, with OpenDistro for Elasticsearch and Kibana 1.11.0. Compare the trigger results with the expected severity selection, then confirm that only the severity 1 action occurs when CPU usage reaches 90%.
Written by the indexing model from the issue text.
Assessment
- Tech stack
- kotlin
- Domain
- backend, observability
- Issue type
- Bug
- Difficulty
- 4/5
- Estimated time
- 3-5 days
- Activity status
- Stale
- Clarity
- Mostly clear
- Newbie friendliness
- 35/100