Suite Dashboard scatterplot controls are missing
Nobody has claimed this yet.
- Dominant language
- TypeScript
- Stars
- 33
- Forks
- 30
- Avg merge
- 2d 21h
- Merged PRs (30d)
- 6
Description
When initially loading the 'analysis' tab of a suite, I get teased with these controls that are responsible for adjusting axes in the scatter plot:

After loading the full Dashboard, these controls have disappeared:
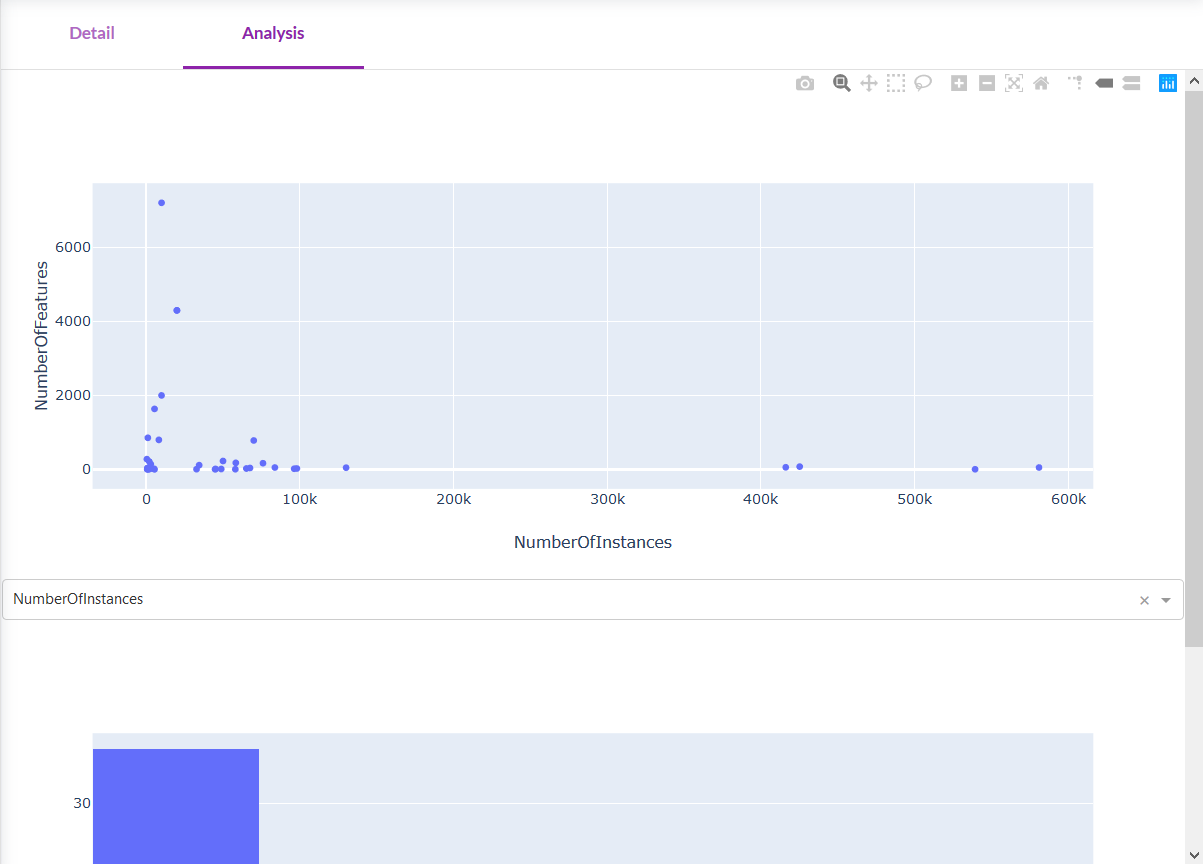
I can not adjust the scatterplot axes. The visible dropdown is to change the histogram.
So for some reason the scatter plot results disappear between loading the dashboard and loading the graphs/data. I would expect them to stay (and allow me to configure the scatter plot).
Contributor guide
No contributing guide indexed for this repository
First steps
- Read the whole issue, then the project's contributing guide.
- Comment on the issue to say you are picking it up — it saves two people doing the same work.
- Fork the repository and make your change on a branch.
- Open a pull request that references the issue number.
Research direction
Start by reproducing the issue in the Suite Dashboard's analysis tab, comparing the initial load with the fully loaded graphs and data. Trace the frontend entry point for the scatterplot controls and determine where they disappear; done means the axis controls remain available after loading and can adjust the scatterplot axes.
Written by the indexing model from the issue text.
Assessment
- Tech stack
- react, typescript
- Domain
- data-visualization, frontend
- Issue type
- Bug
- Difficulty
- 3/5
- Estimated time
- 1-2 days
- Activity status
- Stale
- Clarity
- Mostly clear
- Newbie friendliness
- 38/100