microsoft / microsoft/vscode-cpptools
It will finish the debug when I click the Registers list.
Open
Nobody has claimed this yet.
debugger
more info needed
- Dominant language
- TypeScript
- Stars
- 6.2k
- Forks
- 1.7k
- Avg merge
- 14h 46m
- Merged PRs (30d)
- 61
Description
Environment
- OS and version: Windows 10 21H2
- VS Code: 1.75.1
- C/C++ extension: v1.14.3
Bug Summary and Steps to Reproduce
Bug Summary:
It will finish the debug when I click the Registers list.
This is my code:
#include <cstdlib>
#include <iostream>
#include <string>

using namespace std;

int main(void) {

    int a = 10;
    cout << "hello!" << endl;

    system("pause");
    return 0;
}
I set a breakpoint to debug.
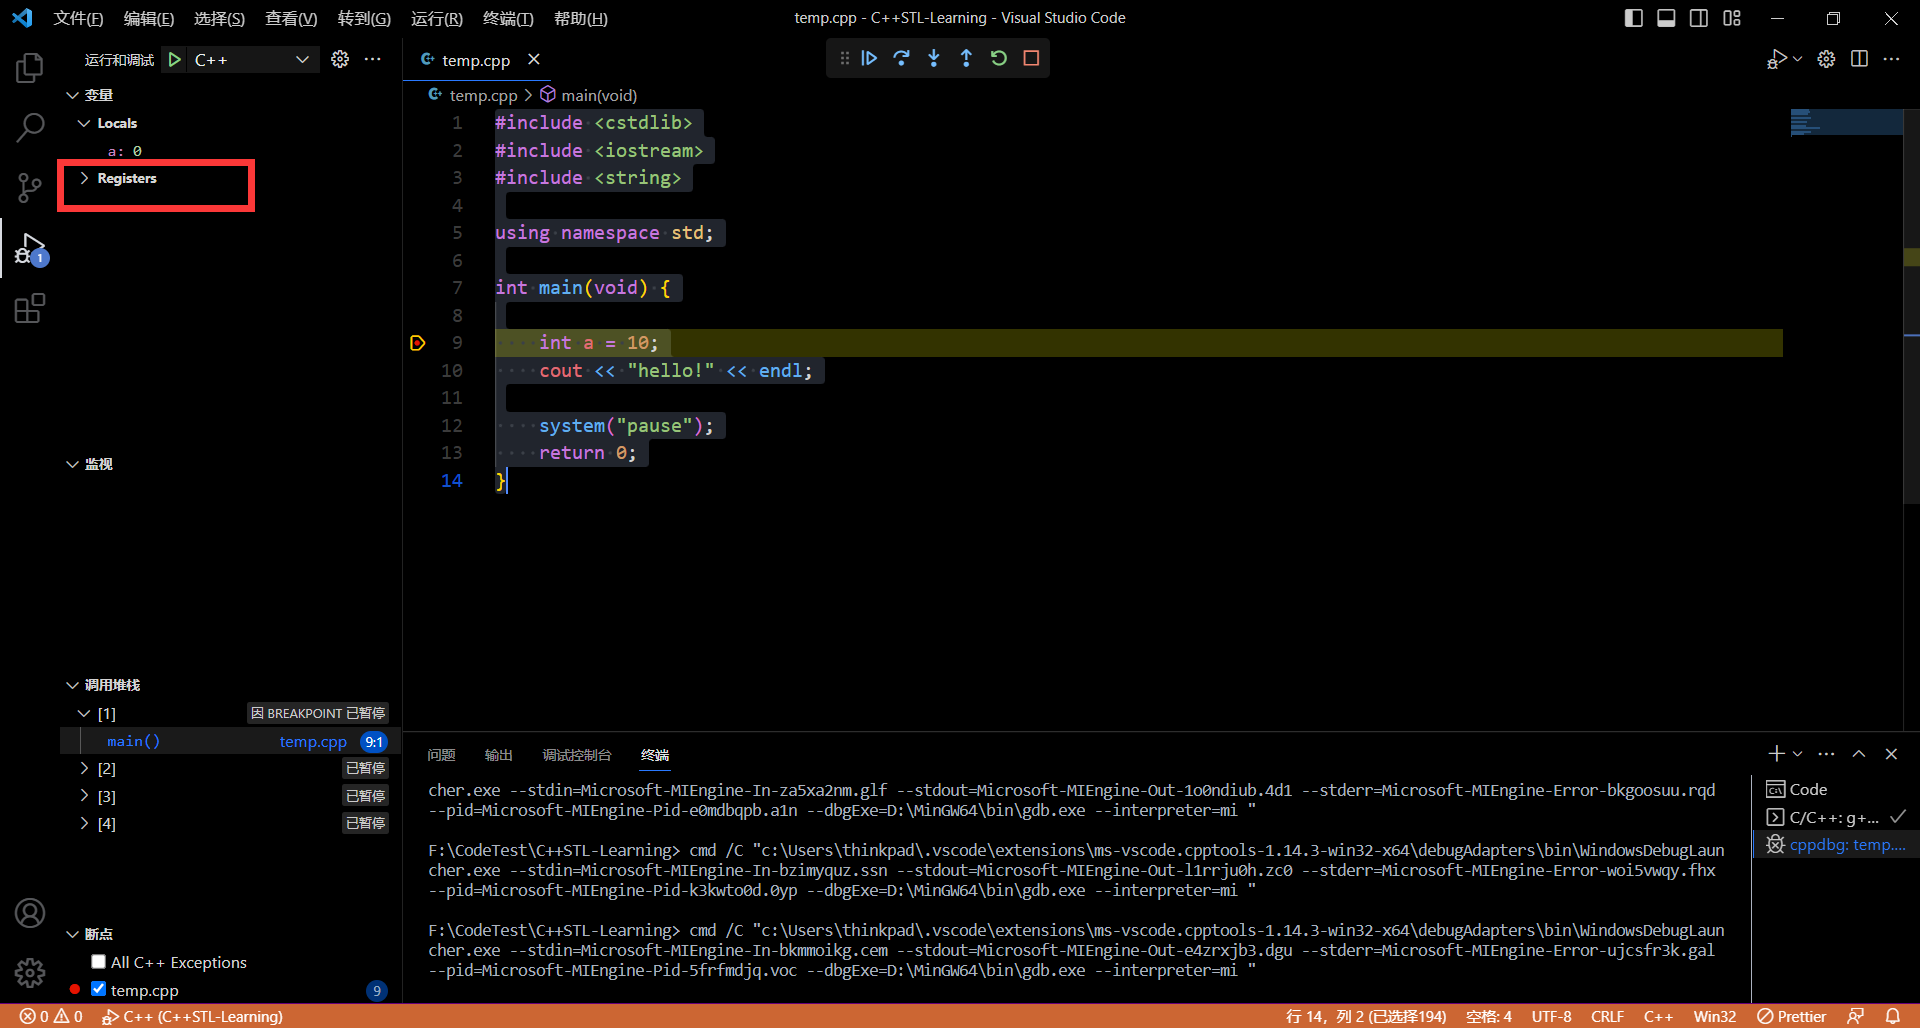
When I click the Registers list, it will exit the debug mode.
Debugger Configurations
//  tasks.json
{
    "tasks": [
        {
            "type": "cppbuild",
            "label": "C/C++: g++.exe 生成活动文件",
            "command": "D:\\MinGW64\\bin\\g++.exe",
            "args": [
                "-fdiagnostics-color=always",
                "-g",
                "${file}",
                "-o",
                "${fileDirname}\\${fileBasenameNoExtension}.exe"
            ],
            "options": {
                "cwd": "${fileDirname}"
            },
            "problemMatcher": [
                "$gcc"
            ],
            "group": {
                "kind": "build",
                "isDefault": true
            },
            "detail": "调试器生成的任务。"
        }
    ],
    "version": "2.0.0"
}

// launch.json
{
    // 使用 IntelliSense 了解相关属性。
    // 悬停以查看现有属性的描述。
    // 欲了解更多信息,请访问: https://go.microsoft.com/fwlink/?linkid=830387
    "version": "0.2.0",
    "configurations": [
        {
            "name": "C++",
            "type": "cppdbg",
            "request": "launch",
            "program": "${fileBasename}.exe",
            "args": [],
            "stopAtEntry": false,
            "cwd": "${fileDirname}",
            "environment": [],
            "externalConsole": false,
            "pipeTransport": {
                "debuggerPath": "/usr/bin/gdb",
                "pipeProgram": "${env:windir}\\system32\\bash.exe",
                "pipeArgs": [
                    "-c"
                ],
                "pipeCwd": ""
            },
            "setupCommands": [
                {
                    "description": "为 gdb 启用整齐打印",
                    "text": "-enable-pretty-printing",
                    "ignoreFailures": true
                },
                {
                    "description": "将反汇编风格设置为 Intel",
                    "text": "-gdb-set disassembly-flavor intel",
                    "ignoreFailures": true
                }
            ]
        }
    ]
}
Debugger Logs
=thread-group-added,id="i1"
GNU gdb (GDB) 8.1
Copyright (C) 2018 Free Software Foundation, Inc.
License GPLv3+: GNU GPL version 3 or later <http://gnu.org/licenses/gpl.html>
This is free software: you are free to change and redistribute it.
There is NO WARRANTY, to the extent permitted by law.  Type "show copying"
and "show warranty" for details.
This GDB was configured as "x86_64-w64-mingw32".
Type "show configuration" for configuration details.
For bug reporting instructions, please see:
<http://www.gnu.org/software/gdb/bugs/>.
Find the GDB manual and other documentation resources online at:
<http://www.gnu.org/software/gdb/documentation/>.
For help, type "help".
Type "apropos word" to search for commands related to "word".
Warning: Debuggee TargetArchitecture not detected, assuming x86_64.
=cmd-param-changed,param="pagination",value="off"
[New Thread 14444.0x4c]
[New Thread 14444.0x5b4]
[New Thread 14444.0x42f4]
[New Thread 14444.0x388c]

Thread 1 hit Breakpoint 1, main () at F:\CodeTest\C++STL-Learning\temp.cpp:9
9	    int a = 10;
Loaded 'C:\WINDOWS\SYSTEM32\ntdll.dll'. Symbols loaded.
Loaded 'C:\WINDOWS\System32\kernel32.dll'. Symbols loaded.
Loaded 'C:\WINDOWS\System32\KernelBase.dll'. Symbols loaded.
Loaded 'C:\WINDOWS\System32\msvcrt.dll'. Symbols loaded.
Loaded 'D:\MinGW64\bin\libstdc++-6.dll'. Symbols loaded.
Loaded 'C:\WINDOWS\System32\user32.dll'. Symbols loaded.
Loaded 'C:\WINDOWS\System32\win32u.dll'. Symbols loaded.
Loaded 'C:\WINDOWS\System32\gdi32.dll'. Symbols loaded.
Loaded 'D:\MinGW64\opt\bin\libgcc_s_seh-1.dll'. Symbols loaded.
Loaded 'C:\WINDOWS\System32\gdi32full.dll'. Symbols loaded.
Loaded 'D:\MinGW64\opt\bin\libwinpthread-1.dll'. Symbols loaded.
Loaded 'C:\WINDOWS\System32\msvcp_win.dll'. Symbols loaded.
Loaded 'C:\WINDOWS\System32\ucrtbase.dll'. Symbols loaded.
Loaded 'C:\WINDOWS\System32\imm32.dll'. Symbols loaded.
Execute debugger commands using "-exec <command>", for example "-exec info registers" will list registers in use (when GDB is the debugger)
ERROR: GDB exited unexpectedly. Debugging will now abort.
The program 'F:\CodeTest\C++STL-Learning\temp.exe' has exited with code -1 (0xffffffff).
Other Extensions
No response
Additional Information
No response
Contributor guide
First steps
- Read the whole issue, then the project's contributing guide.
- Comment on the issue to say you are picking it up — it saves two people doing the same work.
- Fork the repository and make your change on a branch.
- Open a pull request that references the issue number.
Research direction
Start by reproducing the failure with the supplied launch.json and tasks.json, then compare the debugger logs around the Registers-list interaction and the unexpected GDB exit. Done means selecting Registers no longer aborts the debug session on the stated Windows, VS Code, extension, and GDB setup.
Written by the indexing model from the issue text.
Assessment
- Tech stack
- cpp, typescript
- Domain
- devtools
- Issue type
- Bug
- Difficulty
- 4/5
- Estimated time
- 3-5 days
- Activity status
- Stale
- Clarity
- Mostly clear
- Newbie friendliness
- 35/100