🩺 CI Health — Last 7 days
- Dominant language
- C#
- Stars
- 6.3k
- Forks
- 991
- Avg merge
- 2d 12h
- Merged PRs (30d)
- 201
Description
Window: last **7d** (Sep 4–10, 2026) · vs prior 7d (Aug 28–Sep 3) · trend: last **~18 days** · generated Sep 10, 2026 · numbers are volume-weighted pooled counts (a low-build weekend day can't swing them — see note ▾)
### 📊 Are we improving?
**Net: regressing.** The steadiest, highest-volume lane 🔀 **PR validation fell from 80% to 71% on real volume**, while GH main and internal main also declined sharply; the release swings are tiny-n noise, but the broad multi-lane direction is worse.
| | Lane pass (same lanes & order as §🚦) | prior 7d → **this 7d** | Δ |
|---|---|---|---|
| ↓ | [**🌳 GH CI — main**](https://github.com/microsoft/aspire/actions/workflows/ci.yml?query=event%3Apush+branch%3Amain) | 38% → **16%** | Δ−22 _(prior 15/39; this 4/25; rolling lane has no rerun net)_ |
| ↓ | [**🌿 GH CI — release/13.5**](https://github.com/microsoft/aspire/actions/workflows/ci.yml?query=event%3Apush+branch%3Arelease%2F13.5) | 67% → **0%** | Δ−67 _(tiny n: 0/1; prior 2/3)_ |
| → | [**🧪 GH CI outerloop — main**](https://github.com/microsoft/aspire/actions/workflows/tests-outerloop.yml?query=event%3Aschedule+branch%3Amain) | 0% → **0%** | Δ0 _(tiny n: 0/7; prior 0/7; one scheduled run/day)_ |
| ↓ | [**🏗️ Internal (AzDO) — main**](https://dev.azure.com/dnceng/internal/_build?definitionId=1602) | 74% → **47%** | Δ−27 _(prior 20/27; this 9/19)_ |
| ↓ | [**🏗️ Internal (AzDO) — release/13.5**](https://dev.azure.com/dnceng/internal/_build?definitionId=1602) | 100% → **0%** | Δ−100 _(tiny n: 0/1; prior 4/4)_ |
| ↓ | [**🔀 GH CI — PR validation**](https://github.com/microsoft/aspire/actions/workflows/ci.yml?query=event%3Apull_request) ⭐ | 80% → **71%** | Δ−9 _(real volume: 161/228; prior 327/411)_ |
| → | **🔴 broken backlog** | fresh ciinsights queries unavailable | scoped fallback found 0 builds; last-published retained slice (≤ Jun 30) remains stale |
### 🚦 Pass rate by lane
| Lane | Pass (✅/total) | Δ vs prior 7d |
|------|------|--------------|
| [**🌳 GH CI — main**](https://github.com/microsoft/aspire/actions/workflows/ci.yml?query=event%3Apush+branch%3Amain) | 🔴 **16%** (4/25) | ↓ 22 pts _(prior 15/39; rolling lane has no rerun net)_ |
| [**🌿 GH CI — release/13.5**](https://github.com/microsoft/aspire/actions/workflows/ci.yml?query=event%3Apush+branch%3Arelease%2F13.5) | 🔴 **0%** (0/1) | ↓ 67 pts _(tiny n; prior 2/3)_ |
| [**🧪 GH CI outerloop — main**](https://github.com/microsoft/aspire/actions/workflows/tests-outerloop.yml?query=event%3Aschedule+branch%3Amain) | 🔴 **0%** (0/7) | → 0 pts _(tiny n; prior 0/7; scheduled lane auto-reruns separately)_ |
| [**🏗️ Internal (AzDO) — main**](https://dev.azure.com/dnceng/internal/_build?definitionId=1602) | 🔴 **47%** (9/19) | ↓ 27 pts _(prior 20/27; 10 failures, [latest failed build](https://dev.azure.com/dnceng/internal/_build/results?buildId=3071656&view=results))_ |
| [**🏗️ Internal (AzDO) — release/13.5**](https://dev.azure.com/dnceng/internal/_build?definitionId=1602) | 🔴 **0%** (0/1) | ↓ 100 pts _(tiny n; prior 4/4; [latest failed build](https://dev.azure.com/dnceng/internal/_build/results?buildId=3071098&view=results))_ |
| [**🔀 GH CI — PR validation**](https://github.com/microsoft/aspire/actions/workflows/ci.yml?query=event%3Apull_request) ⭐ | 🟡 **71%** (161/228) | ↓ 9 pts _(real volume; prior 327/411)_ |
🧪 outerloop-release/13.5 omitted — no scheduled outerloop runs on release/13.5.
🧱 infra share: **n/a fresh this window** — full ciinsights health/flagged queries errored and the scoped fallback found 0 ingested builds, so no current test/infra classification can be computed. The last published retained slice (≤ Jun 30) was **~74%** environmental failures; that is stale context, not this week's rate. Details ▾.
### 📈 Trend — pass rate over the last ~18 days
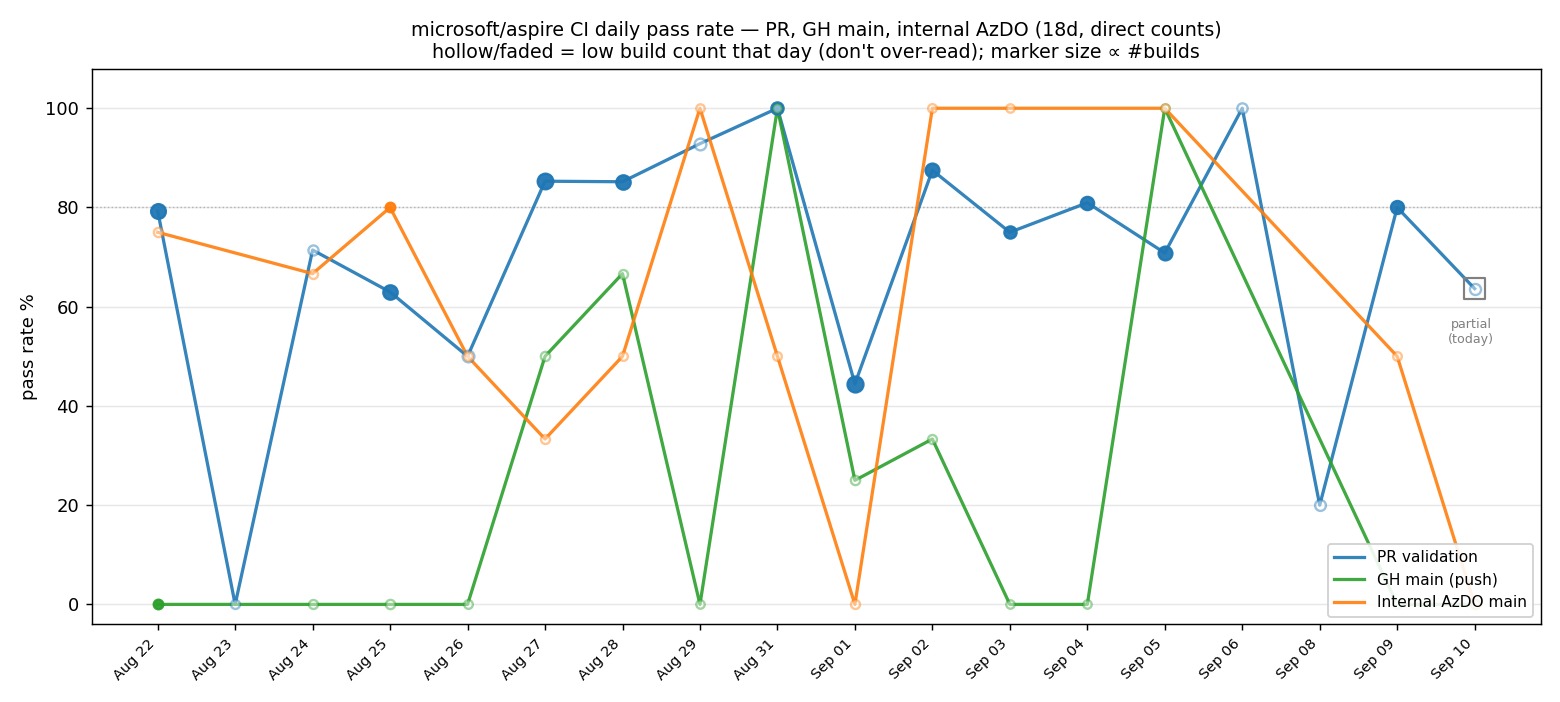
Three lanes on the same direct gh-run/AzDO basis. **Low-build days are hollow/faded and marker size ∝ #builds**; Sep 10 (rightmost, boxed) is partial at 7/11 PR, 0/3 GH-main, and 0/3 internal-main. This tier recomputes only today's row and freezes prior published cells. Missing dates are gaps where no weekly snapshot was published, not zero-run days.
📅 Per-day numbers — PR, GH main, internal AzDO main (newest first)
| Day | 🔀 PR % | 🌳 GH main % | 🏗️ Internal main % |
|---|---|---|---|
| `Sep 10` | _64% (7/11)_ | _0% (0/3)_ | _0% (0/3)_ |
| `Sep 09` | _80% (16/20)_ | _0% (0/2)_ | _50% (1/2)_ |
| `Sep 08` | 20% (2/10) | — | — |
| `Sep 06` | 100% (8/8) | — | — |
| `Sep 05` | _71% (17/24)_ | _100% (1/1)_ | _100% (1/1)_ |
| `Sep 04` | _81% (17/21)_ | _0% (0/1)_ | — |
| `Sep 03` | _75% (12/16)_ | _0% (0/1)_ | _100% (1/1)_ |
| `Sep 02` | _88% (21/24)_ | _33% (1/3)_ | _100% (2/2)_ |
| `Sep 01` | _44% (16/36)_ | _25% (1/4)_ | _0% (0/3)_ |
| `Aug 31` | _100% (16/16)_ | _100% (2/2)_ | _50% (1/2)_ |
| `Aug 29` | _93% (13/14)_ | _0% (0/1)_ | _100% (1/1)_ |
| `Aug 28` | _85% (23/27)_ | _67% (2/3)_ | _50% (1/2)_ |
| `Aug 27` | _85% (29/34)_ | _50% (2/4)_ | _33% (1/3)_ |
| `Aug 26` | _50% (7/14)_ | _0% (0/2)_ | _50% (1/2)_ |
| `Aug 25` | _63% (17/27)_ | _0% (0/4)_ | _80% (4/5)_ |
| `Aug 24` | _71% (5/7)_ | _0% (0/3)_ | _67% (2/3)_ |
| `Aug 23` | _0% (0/3)_ | — | — |
| `Aug 22` | 79% (23/29) | 0% (0/5) | 75% (3/4) |
Direct counts (completed runs, `success/(success+failure)`); internal counts `partiallySucceeded` as success. _Italic_ = low build count that day — read directionally. Today's row is recomputed from the partial day; every earlier cell is copied verbatim from the previous published body, so an older partial snapshot may not match the later full-day count used in the pooled §3 headline. Oldest rows roll off at ~18 retained snapshots.
### ⏱️ Build times — by pipeline
p50/p95 over the same completed-run set as pass rate; PR and push cohorts kept separate.
| Pipeline | p50 (this wk) | p95 (this wk) | Δ p50 vs prior wk |
|----------|---------------|---------------|-------------------|
| [🌳 **GH CI — main**](https://github.com/microsoft/aspire/actions/workflows/ci.yml?query=event%3Apush+branch%3Amain) (push) | 50m | 84m | ↑ 19m (was 31m) |
| [🌿 **GH CI — release/13.5**](https://github.com/microsoft/aspire/actions/workflows/ci.yml?query=event%3Apush+branch%3Arelease%2F13.5) (push) | 52m | 52m | ↑ 22m (was 30m) _(tiny n: 1 this / 3 prior)_ |
| [🏗️ **Internal (AzDO) — main**](https://dev.azure.com/dnceng/internal/_build?definitionId=1602) | 98m | 135m | ↑ 7m (was 91m) |
| [🏗️ **Internal (AzDO) — release/13.5**](https://dev.azure.com/dnceng/internal/_build?definitionId=1602) | 128m | 128m | ↑ 35m (was 93m) _(tiny n: 1 this / 4 prior)_ |
GH durations: `run_started_at`→`updated_at`. Internal: `startTime`→`finishTime`. Every measured median rose: GH main by 19m and internal main by 7m, while both release rows are directional only because each has one current build. **PR validation build time is intentionally excluded:** the `ci.yml` pull-request run is only the short gating workflow and does not measure end-to-end PR test time.
### 🔧 Triage worklist — fix these first
> ⚠️ **All ciinsights-backed rows remain stale and unconfirmed.** The full queries errored and the scoped fallback found no builds in the last 7d. The rows below preserve the last published retained slice (newest failure ~Jun 30), so every item needs **confirm fixed vs stopped running**. Current incidents already carried by the [CI Pulse](https://github.com/microsoft/aspire/issues/18232) are deliberately not duplicated here.
| Severity | fails/runs | Test | Last failed |
|----------|------------|------|-------------|
| 🔴 broken (stale?) | **~2000+ fails** (100%), ~90 tests | **Aspire.Hosting.* provider integration family** — MongoDB, Kubernetes/Helm, PostgreSQL, JavaScript, RabbitMQ, SqlServer, Python, MySql, Nats, Redis, Containers; broad container/integration shape. | Jun 28–29 ⚠️ ~73–74d — confirm fixed vs stopped |
| 🔴 broken (stale?) | **~1300+ fails** (100%), 58 tests | **Aspire.Cli.EndToEnd / Tests harness** — Ollama, OtelLogs, Describe/ResourceCommand, LogsCommand, AgentMcp, Smoke `LatestCli`, StopNonInteractive, EmptyAppHostTemplate; shared CLI E2E harness shape. | Jun 30 ⚠️ ~72d — confirm fixed vs stopped |
| 🔴 broken (stale?) | **~180 fails** (100%), 12 tests | **Conformance family** across EFCore.SqlServer, Qdrant, RabbitMQ, MongoDB, and other providers — likely one shared conformance-suite fix. | Jun 24–30 ⚠️ ~72–78d — confirm fixed vs stopped |
| 🟡 flaky | — | **None currently observable in ciinsights.** Use rerun volume (§9) only as a proxy until fresh ingestion/query access resumes. | n/a |
Counts are from the previously published retained ciinsights slice (all pre-window, ≤ Jun 30), not a fresh historical query. Rows group same-shape families so one likely root cause is one row. The broken families and the live flaky/rerun tax have distinct root causes and should be triaged separately.
---
📖 Dominant story & week-over-week detail — broad regression across PR, GH main, and internal main; build times also rose
**The dominant story is a broad regression, not a small-lane wobble.** The high-volume PR lane moved down materially, and both rolling GH main and internal main reinforced the same direction. The much larger release deltas come from one-build current samples and do not drive the verdict.
**The decline is visible beyond the pooled headline.** Recent frozen snapshots are volatile, but GH main has stayed predominantly red and today's partial PR/internal points are also soft. All measured build-time medians rose, so the week became both less reliable and slower. The §3 headline and §4 trend remain on the same direct-count basis, with pre-today cells frozen as first-computation snapshots.
**The flaky tax remained high:** **60 PR branches** needed reruns and **44 recovered**, while 16 never went green. The bot carried most of that recovery. The largest retained broken family remains the stale Aspire.Hosting provider-integration cluster (~2000+ failures), which is historical context rather than a live ranking while ciinsights ingestion remains empty.
⚖️ Why a low-build weekend can't mislead the headline (weighting note)
The lane percentages and deltas are **pooled counts** — `Σsuccess / Σtotal` over the 7-day window — not an average of daily rates. A quiet day contributes only its actual builds to the 228-run PR denominator, so it cannot swing the headline like a full-weight day.
Low volume can distort only the **per-day chart/grid**, where a 1–2 build day appears as a full 0% or 100% point. The chart handles that visually: low-build days are hollow/faded, marker size is proportional to build count, today is boxed as partial, and low-build table cells are italicized. A faded point means “not enough signal,” not a real swing.
_(A 7-day trailing pooled overlay remains deferred because a second line per lane would reduce readability; the pooled headline plus low-volume de-emphasis already addresses the misleading-spike problem.)_
🔁 Auto-rerun & the flaky tax — 44 rerun-affected PR branches recovered; 16 did not
PR-validation reruns (`run_attempt > 1`, 7d):
- 🤖 **Auto-rerun bot:** 244 rerun attempts across 49 distinct PR branches → **37 branches rescued** red→green; 12 branches not rescued by the bot.
- 🧑 **Manual (human) reruns:** 31 rerun attempts across 13 branches → **9 rescued**; 4 still red.
- 🔗 **Combined: 60 distinct PR branches** needed ≥1 rerun; **44 went green**, 16 never went green; 2 branches needed both bot and human.
The bot carried most rescues, but humans still spent effort on 13 branches. The 16 branches that never went green are the deterministic residue that reruns could not clear. Attribution reflects each run's latest attempt only, and distinct-PR counts use head branch as the documented proxy.
🧱 Infrastructure failures — fresh share unavailable; last-published retained context ~74%
**A fresh in-window infra share cannot be computed.** The full ciinsights health/flagged queries errored, and the scoped health fallback reported zero ingested builds in the last 7d. The last published retained slice (≤ Jun 30) classified **~74%** of failed builds as environmental, mostly long-duration timeout-style failures on genuine branches that were often rescued on rerun.
That figure is stale attempt-level context, not this week's rate. It inflates the failed-build denominator but historically rarely blocked merge. Group by **base branch + job name** before acting on it, and recompute once ingestion/query access is current.
Sources: ciinsights MCP/API (degraded this run: connection healthy, but full health/flagged/failure-summary queries errored and scoped health returned 0 builds; retained test/infra context is stale) + `gh api .../ci.yml/runs` (date-bucketed direct counts and rerun outcomes, with run IDs retained for deduplication) + `az pipelines` (internal definition 1602; aggregate counts only). Lane percentages are volume-weighted pooled counts. PR/main/internal trend cells are frozen before today; internal main was backfilled once and remains frozen. Retention ≈18d. Window = trailing 7d (Sep 4–10). Read-only report — no tests changed. **What's on fire right now: see the daily CI Pulse (#18232).** Generated 2026-09-10 11:14 UTC.
Contributor guide
Research direction
Start with the linked GitHub Actions workflows and Azure DevOps builds, then inspect the ciinsights query failures and the stale Aspire.Hosting provider, Aspire.Cli.EndToEnd, and conformance families. Done means confirming which failures are current versus stopped, identifying actionable causes, and avoiding duplication with CI Pulse issue 18232.
Written by the indexing model from the issue text.
Assessment
- Tech stack
- azure, github-actions
- Domain
- ci-cd, devops
- Issue type
- Bug
- Difficulty
- 5/5
- Estimated time
- Over a week
- Activity status
- Active
- Clarity
- Needs clarification
- Newbie friendliness
- 25/100