Ability to use variables in graph titles
- Dominant language
- Clojure
- Stars
- 49.3k
- Forks
- 6.8k
- Avg merge
- 1d 13h
- Merged PRs (30d)
- 653
Description
**Is your feature request related to a problem? Please describe.**
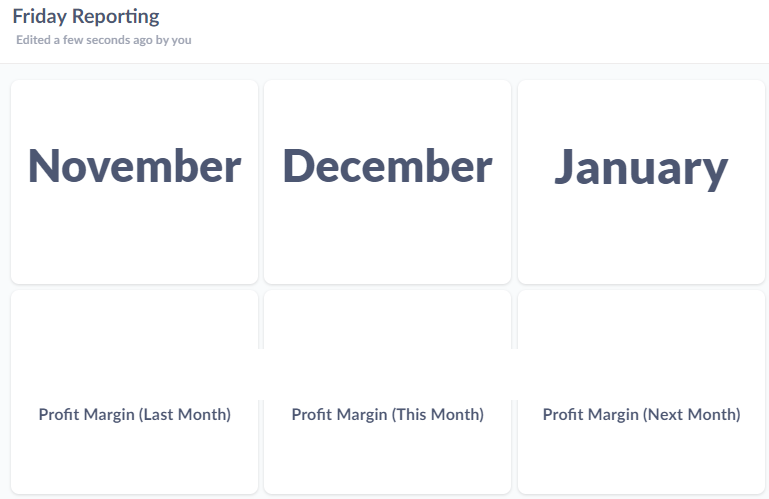
When using time related queries and showing data for "last month", "this month", "next month" on dashboards it would be great to actually be able to put the Month name in the title rather than just "This Month". Sometimes when the month ticks over, some of my user's haven't realised if it happens mid week in regards to the stats changing! Is it possible to allow some sort of custom expression in titles?
**Describe the solution you'd like**
I would like to be able to add some sort of custom expression in the graph title (e.g. {{ = getDate() }} or metabase equivalent.
**Describe alternatives you've considered**
Currently, I am having to use a custom sql select (e.g. select DATENAME(Month, DATEADD(m, -1, getDate())) as Month) and add it as an extra graph when required. This works, but takes up a lot of space as graphs are 3 blocks high.
**How important is this feature to you?**
It doesnt impact the functionality of what we've produced at all, but makes chart context easier to understand and avoids confusion.
**Additional context**
:arrow_down: Please click the :+1: reaction instead of leaving a `+1` or `update?` comment
Contributor guide
Research direction
The issue names no files, tests, or entry points. Start by tracing how dashboard graph titles are rendered and whether title variables are currently supported; clarify the expression syntax, available date values, and dashboard contexts before implementation. Done means users can insert a month value into a graph title and see it update correctly as time ranges change.
Written by the indexing model from the issue text.
Assessment
- Domain
- data-visualization
- Issue type
- Feature
- Difficulty
- 5/5
- Estimated time
- Over a week
- Activity status
- Stale
- Clarity
- Needs clarification
- Newbie friendliness
- 35/100