matplotlib / matplotlib/matplotlib
[ENH]: Built-in support for multi-color and multi-style text.
Nobody has claimed this yet.
- Dominant language
- Python
- Stars
- 23.2k
- Forks
- 8.5k
- Avg merge
- 1d 6h
- Merged PRs (30d)
- 66
Description
### Problem
Creating multi-colored or multi-styled text in Matplotlib requires manual positioning of each text segment with complex spacing calculations.
Users currently need to calculate x-positions manually for each colored segment, which is tedious and error-prone, especially when text properties change.
### Proposed solution
Add a `richtext()` function (or `ax.richtext()` method) that handles multi-color/multi-style text automatically:
**Current approach (manual and tedious):**
```python
fig, ax = plt.subplots()
ax.text(0.1, 0.5, "Hello", color='red', fontsize=20)
ax.text(0.35, 0.5, " ", fontsize=20) # Manual spacing calculation!
ax.text(0.4, 0.5, "World", color='blue', fontsize=20) # More manual work!
```
**Proposed approach (simple and automatic):**
```python
fig, ax = plt.subplots()
ax.richtext(0.5, 0.5,
strings=["Hello", " ", "World"],
colors=["red", None, "blue"],
fontsize=20, ha='center', va='center')
```
**Key Features:**
- Accepts lists of text segments with corresponding colors/styles
- Automatically calculates spacing and positioning
- Supports word wrapping with `box_width` parameter
- Flexible property specification (single values, lists, or dicts)
- Compatible with all standard matplotlib text parameters
**Example Use Cases:**
1. **Data visualization**: Highlight specific values in different colors
2. **Scientific plots**: Format chemical formulas, mathematical notation
3. **Publication-quality figures**: Mixed text styling in titles/labels
**Implementation:**
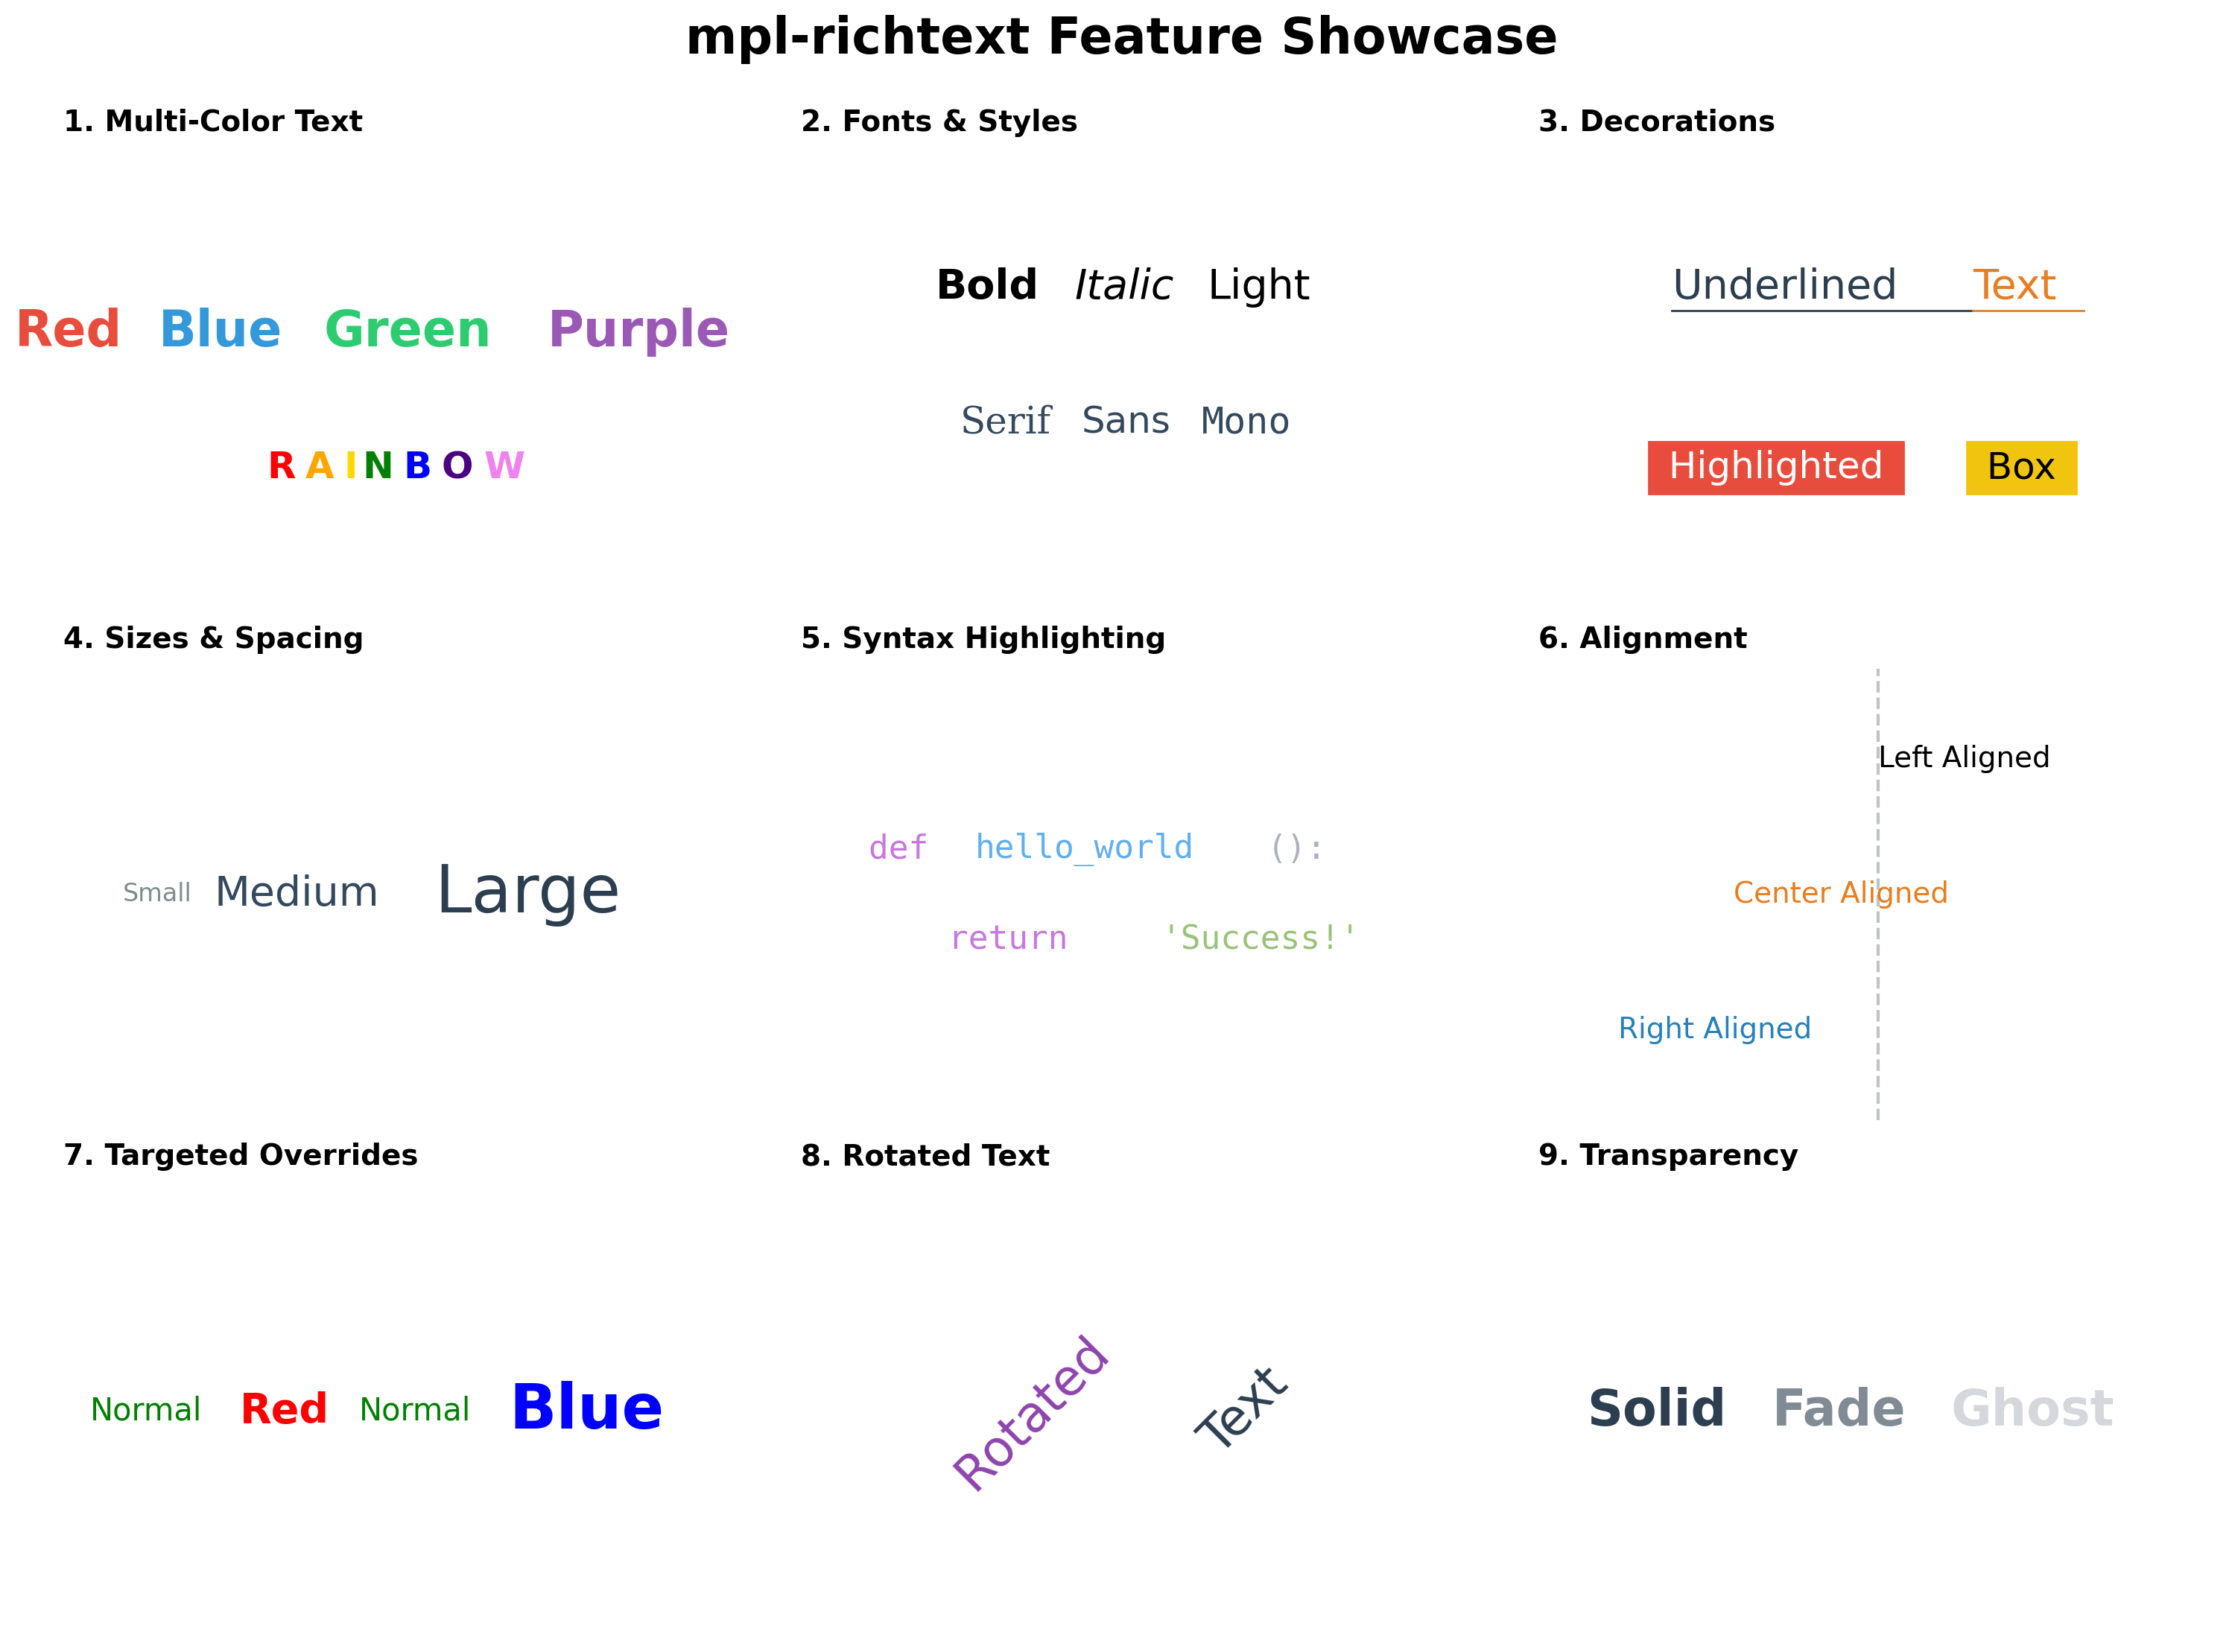
I've created a working proof-of-concept package: [`mpl-richtext`](https://github.com/ra8in/mpl-richtext) (also on [PyPI](https://pypi.org/project/mpl-richtext/))
The implementation:
- Uses matplotlib's renderer for accurate text measurements
- Creates positioned Text objects automatically
- ~400 lines of code
- Handles alignment, wrapping, and various text properties
**Example output:**
**Questions for maintainers:**
1. Is this functionality suitable for matplotlib core?
2. Should it be a standalone function, an Axes method, or a custom Artist?
3. Any concerns about the implementation approach?
I'm willing to contribute this to matplotlib and adapt it based on maintainer feedback. Open to API redesign or implementation changes as needed.
Contributor guide
First steps
- Read the whole issue, then the project's contributing guide.
- Comment on the issue to say you are picking it up — it saves two people doing the same work.
- Fork the repository and make your change on a branch.
- Open a pull request that references the issue number.
Research direction
Start with the linked mpl-richtext proof of concept and the proposed richtext()/ax.richtext() entry points. Compare its renderer-based measurement, alignment, wrapping, and property handling with Matplotlib's existing text behavior. Done requires a decided core API and an agreed implementation and test scope.
Written by the indexing model from the issue text.
Assessment
- Tech stack
- python
- Domain
- data-visualization
- Issue type
- Feature
- Difficulty
- 5/5
- Estimated time
- Over a week
- Activity status
- Stale
- Clarity
- Needs clarification
- Newbie friendliness
- 25/100