matplotlib / matplotlib/matplotlib
Axes.axes.secondary_xaxis does not produce good ticks with some transformations
Nobody has claimed this yet.
- Dominant language
- Python
- Stars
- 23.2k
- Forks
- 8.5k
- Avg merge
- 1d 6h
- Merged PRs (30d)
- 66
Description
### Bug report
**Bug summary**
If I supply a nonlinear transformation to `secondary_xaxis`, it produces overlapping tick positions, at least when I do not use a logarithmic scale, see images below.
**Code for reproduction**
```python
import matplotlib.pyplot as plt
import numpy as np
c = 299792458.0
fig, ax1 = plt.subplots()
ax1.plot((1e16, 1e19), (0, 1))
ax1.set_xlim(1e16, 1e19)
ax1.set_xlabel(r'$\omega/\mathrm{s^{-1}}$')
ax2 = ax1.secondary_xaxis(-0.15, functions=(
lambda omega: 2 * np.pi * c / omega,
lambda lambda_: 2 * np.pi * c / lambda_)
)
ax2.set_xlabel(r'$\lambda/\mathrm{m}$')
plt.tight_layout()
plt.savefig('issue1.png')
ax1.set_xscale('log')
plt.savefig('issue2.png')
```
**Actual outcome**
Linear:

Logarithmic:
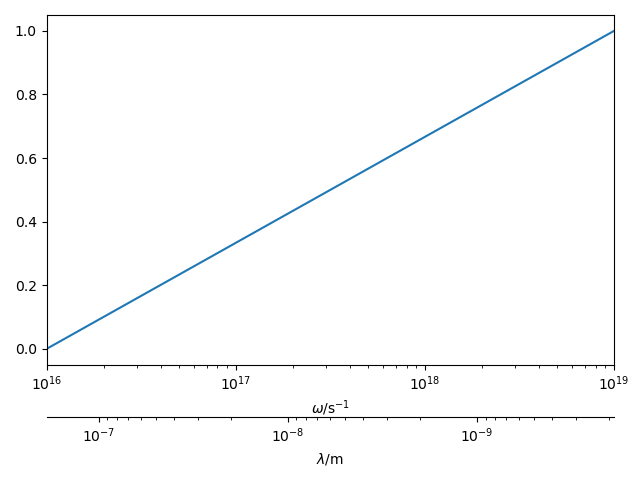
**Expected outcome**
Nice tick placement in both variants.
**Matplotlib version**
* Operating system: Arch Linux
* Matplotlib version (`import matplotlib; print(matplotlib.__version__)`): 3.4.1
* Matplotlib backend (`print(matplotlib.get_backend())`): Qt5Agg
* Python version: 3.9
Contributor guide
First steps
- Read the whole issue, then the project's contributing guide.
- Comment on the issue to say you are picking it up — it saves two people doing the same work.
- Fork the repository and make your change on a branch.
- Open a pull request that references the issue number.
Research direction
Start by running the supplied reproduction with secondary_xaxis, first in the linear case and then with the logarithmic scale, to observe the overlapping tick positions. Trace how secondary_xaxis generates and transforms ticks; done means both variants produce readable, non-overlapping tick placement.
Written by the indexing model from the issue text.
Assessment
- Tech stack
- numpy, python
- Domain
- data-visualization
- Issue type
- Bug
- Difficulty
- 4/5
- Estimated time
- 3-5 days
- Activity status
- Stale
- Clarity
- Mostly clear
- Newbie friendliness
- 35/100