mapbox / mapbox/osm-analysis-dashboard
Dashboard requirements
Nobody has claimed this yet.
- Dominant language
- JavaScript
- Stars
- 6
- Forks
- 3
- PR merge metrics
- No merged PRs in 30d
Description
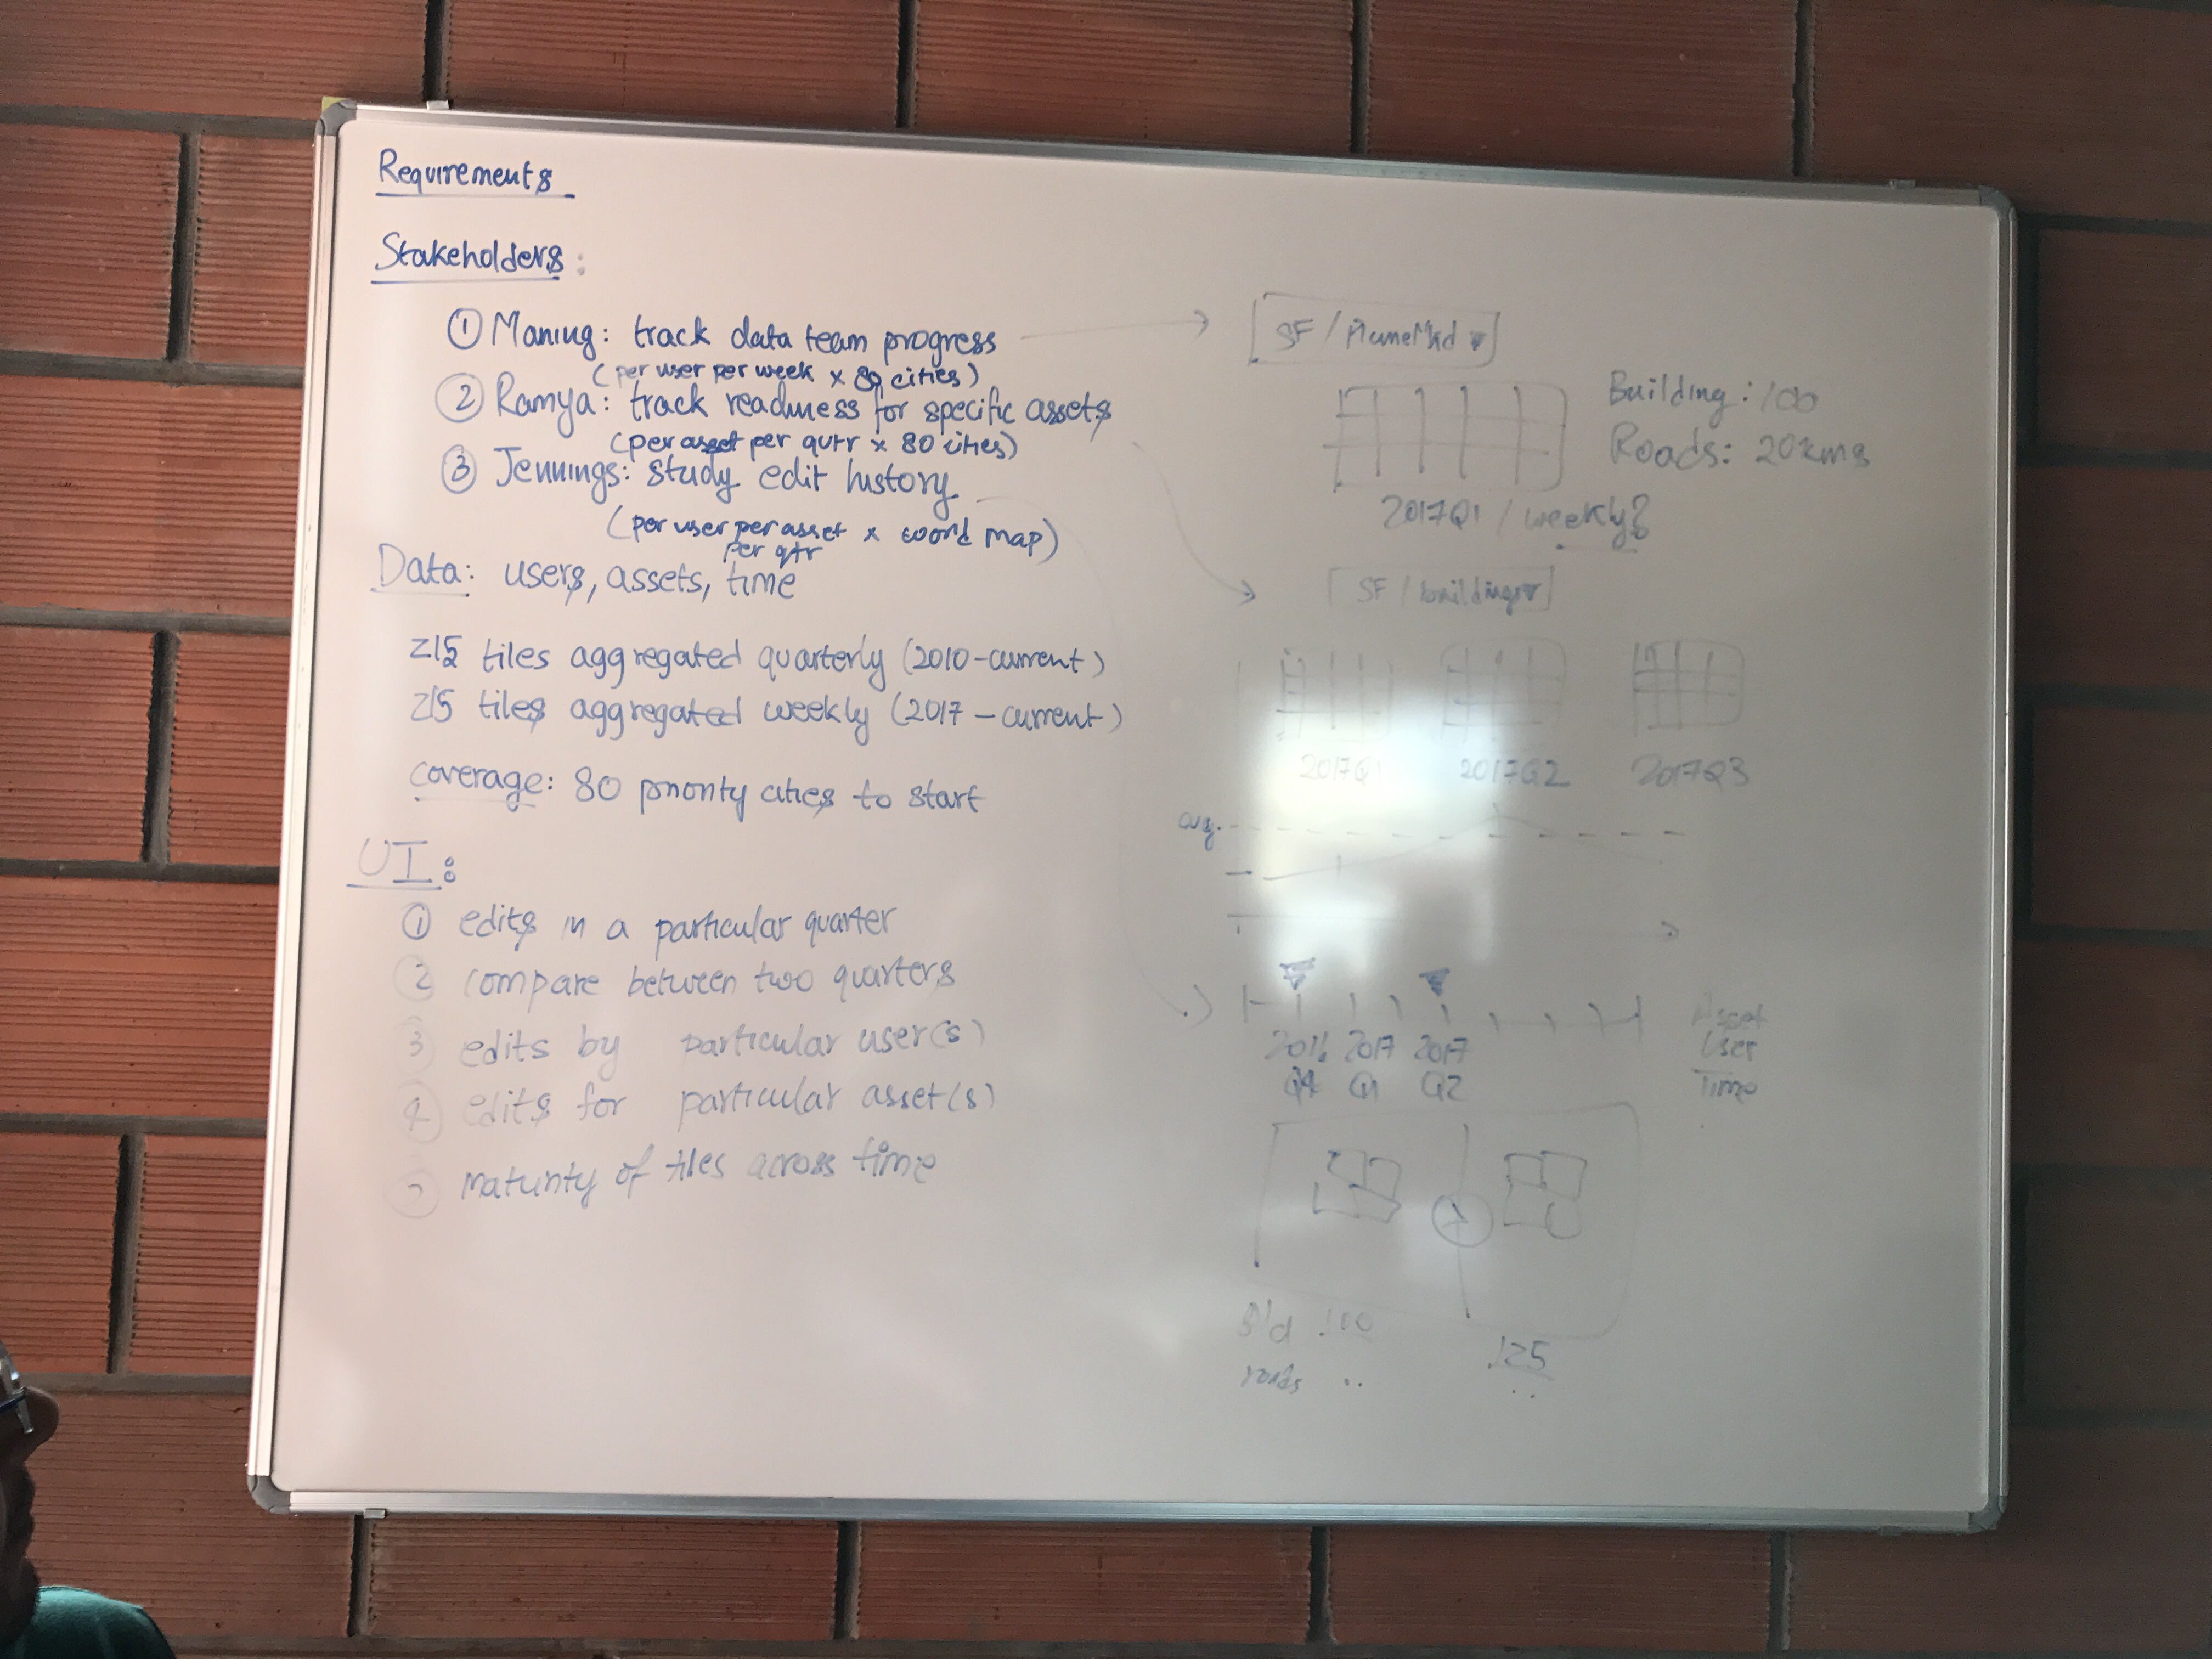
Summarising from conversations with @jenningsanderson and @ramyaragupathy.
---
**Stakeholders**: Jennings, Ramya, Mapbox Data Team
- **Mapbox Data Team**. Track data team edits. Each quarter in 80 priority cities.
- **Readiness**. Track readiness for specific assets. Per assets per quarter in 80 priority cities. See the maturity of edits over time.
- **Jennings**. Study OSM edit history. Per user, per asset, per quarter for the whole 🗺 .
**Data**
- z15 tiles aggregated quarterly from 2010 to current quarter.
- z15 tiles aggregated weekly from 2017 to current quarter.
Coverage: 80 priority cities to start with.
Tilesets with contain historical edit counts, count of users, individuals assets added and readiness metrics.
**Interface**
The dashboard should ideally allow
- seeing edits made in a particular quarter,
- comparing edits between any two quarters,
- filtering edits by one, many or all users,
- filtering edits by one, many or all asset types, and
- comparing maturity of tiles across all quarters.
cc: @jenningsanderson @ramyaragupathy @rasagy @maning
+cc: @ramyaragupathy
Contributor guide
First steps
- Read the whole issue, then the project's contributing guide.
- Comment on the issue to say you are picking it up — it saves two people doing the same work.
- Fork the repository and make your change on a branch.
- Open a pull request that references the issue number.
Research direction
Start with the requirements summary and linked image, then inspect the repository to locate the dashboard entry point. Done means the dashboard supports the requested quarterly comparisons, user and asset-type filters, city coverage, and maturity views, but the issue does not name implementation files or tests.
Written by the indexing model from the issue text.
Assessment
- Tech stack
- javascript
- Domain
- analytics, data-visualization
- Issue type
- Feature
- Difficulty
- 5/5
- Estimated time
- Over a week
- Activity status
- Stale
- Clarity
- Needs clarification
- Newbie friendliness
- 20/100