SVG: support for CSS calc()
Nobody has claimed this yet.
- Dominant language
- JavaScript
- Stars
- 32.7k
- Forks
- 1.4k
- Avg merge
- 1d 14h
- Merged PRs (30d)
- 5
Description
Hello, I want to output a line graph SVG to a png using Sharp. The axis and legends are on top of the padding space of the SVG as overflow, shown in the picture below.

But it seems the padding area does not get included into the output png file.
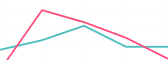
I used the following code to create the output:
```
const element = renderToString(svg);
sharp(Buffer.from(element))
.png()
.toFile("output.png", Object);
```
Here is also a JSFiddle with the SVG:
https://jsfiddle.net/Lefsqo3j/14/
Is there a way for the padding area to be captured in the output png together with the graph?
Thank you.
Contributor guide
First steps
- Read the whole issue, then the project's contributing guide.
- Comment on the issue to say you are picking it up — it saves two people doing the same work.
- Fork the repository and make your change on a branch.
- Open a pull request that references the issue number.
Research direction
Start with the SVG from the linked JSFiddle and the sharp(Buffer.from(element)) conversion entry point; investigate how CSS calc() and overflow/padding are handled during SVG-to-PNG rendering. Done means the padding area shown in the SVG is included in the generated PNG, with coverage for the reported example.
Written by the indexing model from the issue text.
Assessment
- Tech stack
- javascript, nodejs
- Domain
- backend
- Issue type
- Feature
- Difficulty
- 4/5
- Estimated time
- 3-5 days
- Activity status
- Stale
- Clarity
- Needs clarification
- Newbie friendliness
- 28/100