UMAP plot points gathered at edge of axes
- Dominant language
- Python
- Stars
- 8.3k
- Forks
- 871
- Avg merge
- 1d 13h
- Merged PRs (30d)
- 5
Description
Hello,
I am trying to run UMAP via RStudio and I seem to have a scaling issue when trying to plot UMAP1 versus UMAP2. I've attached the plot below for your review.
I used 8 metaclusters via this command:
> cell.dat <- run.flowsom(cell.dat, cluster.cols, meta.k = 8)
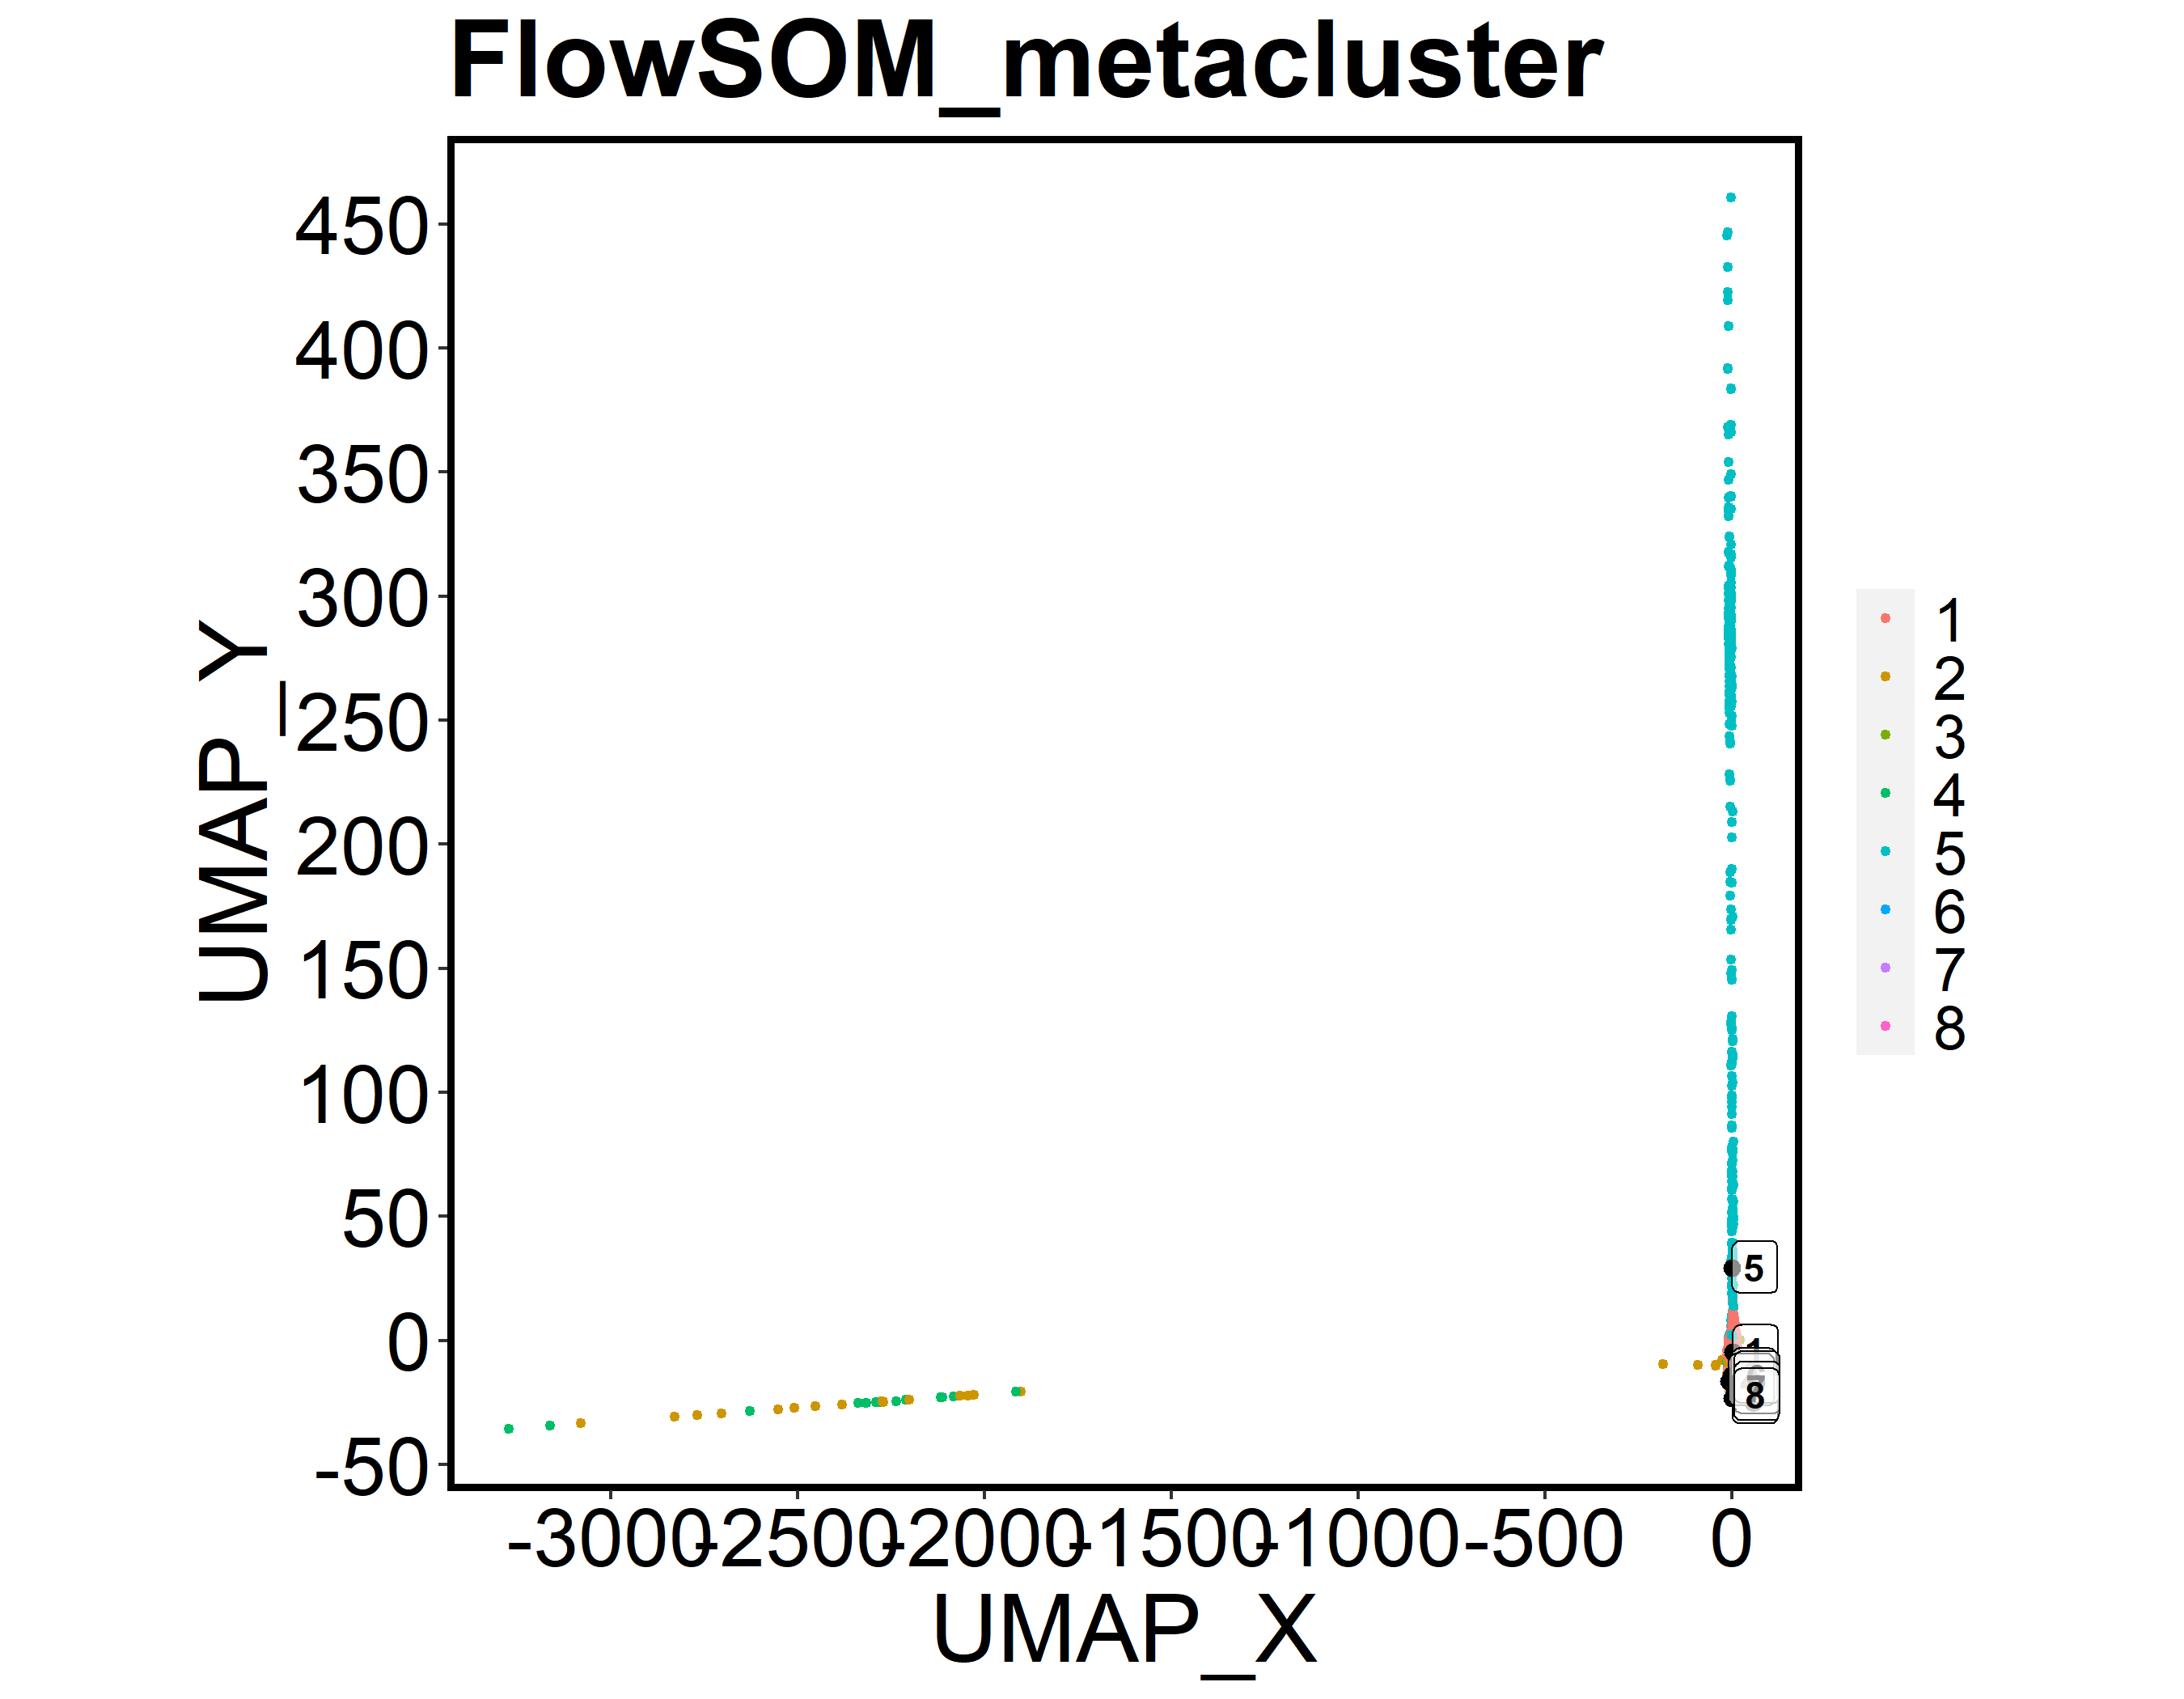
Please let me know if any other information is needed to solve.
Thank you in advance for any suggestions!
Best,
Kayla
Contributor guide
Research direction
Start by reviewing the reported RStudio command `cell.dat <- run.flowsom(cell.dat, cluster.cols, meta.k = 8)` and the attached UMAP1-versus-UMAP2 plot. Determine whether the edge clustering is reproducible and whether the report contains enough information to identify a UMAP or FlowSOM scaling problem; completion requires a reproducible diagnosis or a clearly scoped fix.
Written by the indexing model from the issue text.
Assessment
- Tech stack
- python, r
- Domain
- data-visualization, machine-learning
- Issue type
- Bug
- Difficulty
- 4/5
- Estimated time
- 3-5 days
- Activity status
- Stale
- Clarity
- Needs clarification
- Newbie friendliness
- 25/100