OHLC candle stick chart
Nobody has claimed this yet.
- Dominant language
- JavaScript
- Stars
- 10.5k
- Forks
- 463
- PR merge metrics
- No merged PRs in 30d
Description
Hello everyone,
@leeoniya thank you for this library. Trying to get the ohlc chart to work ... so far looks pretty good ... here is the fiddle
https://jsfiddle.net/5w2y3m9b/
Any way to plot the EMA (the exponential moving average) and possibly a marker at the place where trade took place?
[EDIT] Added the screenshot that show the EMA and markers
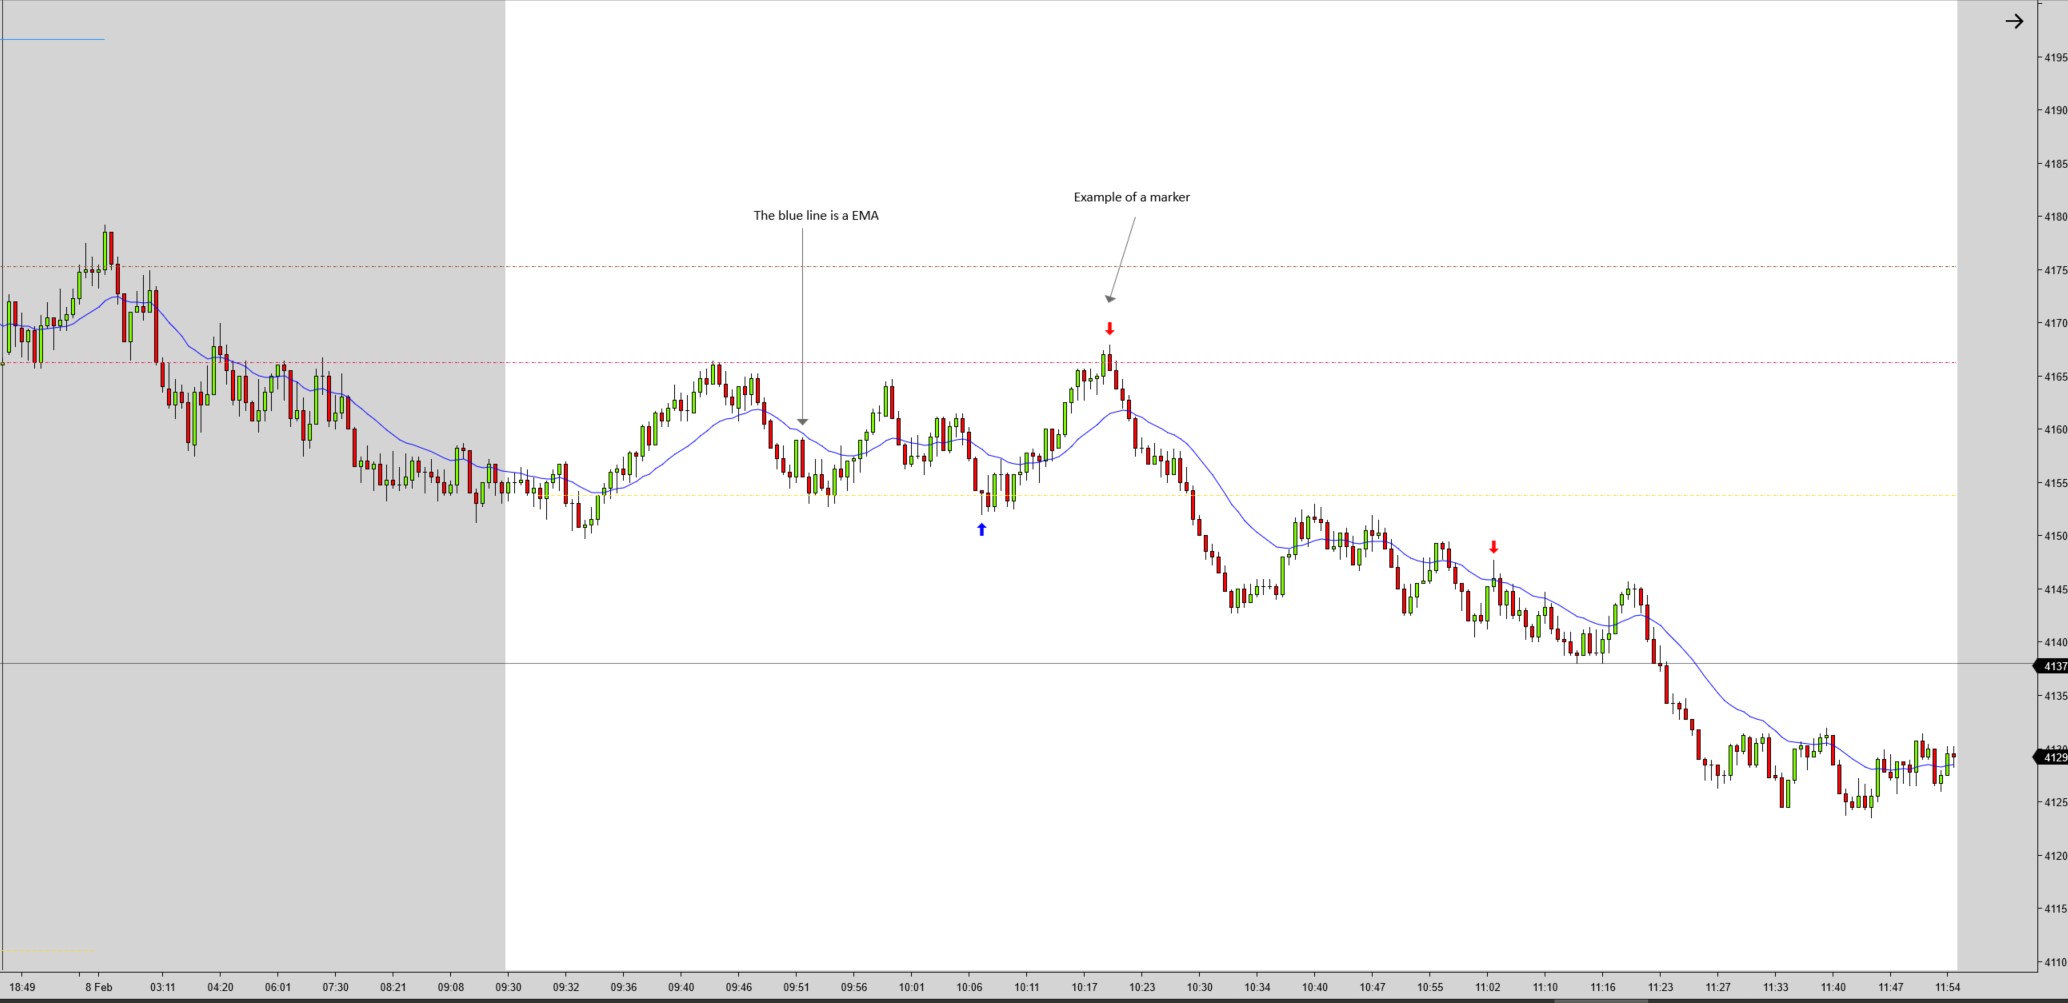
[EDIT] Here is another fiddle https://jsfiddle.net/u6pa0ske/1/ adjusted the labels - since it's an intraday chart I need to show minutes
- Is there a way to turn off volume? tried to comment out
data.push(data[0].map(v => randInt(10, 250)));didn't work - The timezone is off (but that's on my side)
- I'd like to plot an icon - is that possible?
Contributor guide
No contributing guide indexed for this repository
First steps
- Read the whole issue, then the project's contributing guide.
- Comment on the issue to say you are picking it up — it saves two people doing the same work.
- Fork the repository and make your change on a branch.
- Open a pull request that references the issue number.
Research direction
Start by reviewing the OHLC examples in the linked fiddles: https://jsfiddle.net/5w2y3m9b/ and https://jsfiddle.net/u6pa0ske/1/. Clarify whether the requested scope covers EMA lines, trade markers or icons, disabling volume, and intraday minute labels; the work is done when the supported requirements are defined and demonstrated.
Written by the indexing model from the issue text.
Assessment
- Tech stack
- javascript
- Domain
- data-visualization
- Issue type
- Feature
- Difficulty
- 5/5
- Estimated time
- Over a week
- Activity status
- Stale
- Clarity
- Needs clarification
- Newbie friendliness
- 25/100