Wrong zoomed range on Y axis after hiding/showing curve
Nobody has claimed this yet.
- Dominant language
- JavaScript
- Stars
- 10.5k
- Forks
- 463
- PR merge metrics
- No merged PRs in 30d
Description
I wish the zoomed range on Y axis to be maintained when the curve's visibility is toggled.
The following example demonstrates the issue.
https://jsfiddle.net/20sk78Le/13/
If you zoom like the attached image and then hide/show the curve you will notice that the Y axis range is not maintained, while works fine for X axis.
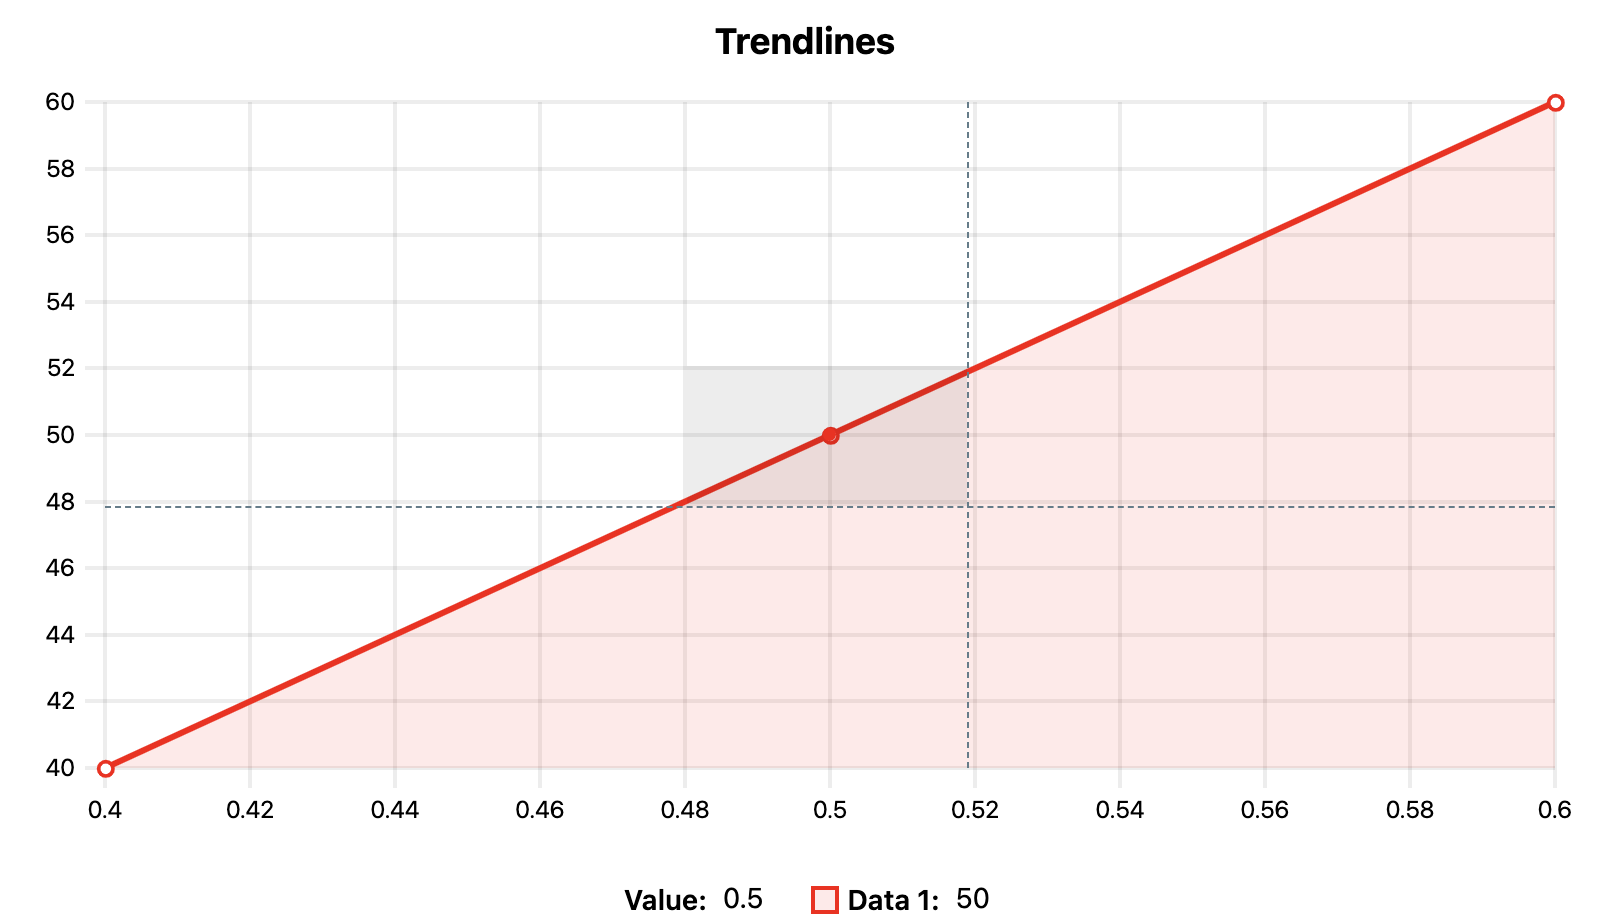
The console.log('Y min:', min, 'max:', max); does not get called when zooming.
Contributor guide
No contributing guide indexed for this repository
First steps
- Read the whole issue, then the project's contributing guide.
- Comment on the issue to say you are picking it up — it saves two people doing the same work.
- Fork the repository and make your change on a branch.
- Open a pull request that references the issue number.
Research direction
Start with the reproducible example at https://jsfiddle.net/20sk78Le/13/ and compare what happens to the X and Y ranges after zooming and toggling curve visibility. Trace the zoom and visibility handling, including why the reported Y-axis console.log is not called. Done means the zoomed Y-axis range remains unchanged when the curve is hidden and shown again.
Written by the indexing model from the issue text.
Assessment
- Tech stack
- javascript
- Domain
- data-visualization
- Issue type
- Bug
- Difficulty
- 3/5
- Estimated time
- 1-2 days
- Activity status
- Stale
- Clarity
- Mostly clear
- Newbie friendliness
- 35/100