Possible bug with scale gradient between two values and zoom level
Nobody has claimed this yet.
- Dominant language
- JavaScript
- Stars
- 10.5k
- Forks
- 463
- PR merge metrics
- No merged PRs in 30d
Description
Hello,
I'm using the scaleGradient function provided by the demo example with the following configuration:
Configuration
paths: stepped ? stepped({align: 1}) : undefined,
drawStyle: 0,
stroke: (u: uPlot) => scaleGradient(u, 'x', 0, true)
scaleGradient is modified by a function to create automatic stops after each y-value change (I'm only drawing discrete values like 0,1,2,3,...).
Color Stops
[...]
[1562031960, "red"]
[1562031960, "blue"]
[1562032830, "red"]
[...]
Problem description
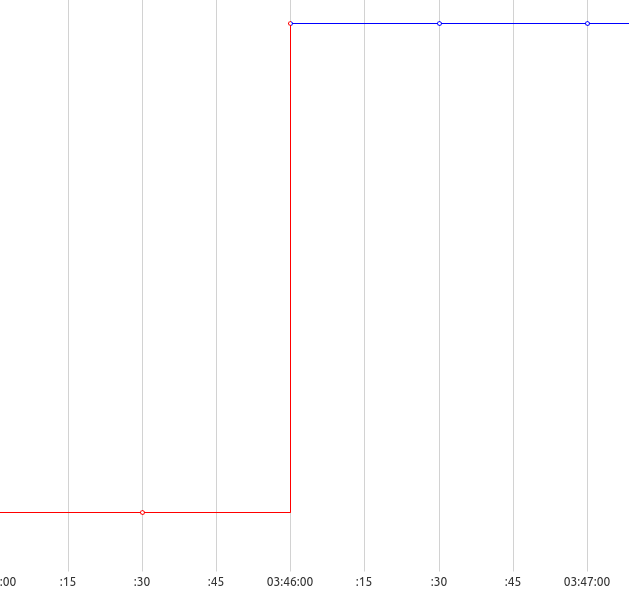
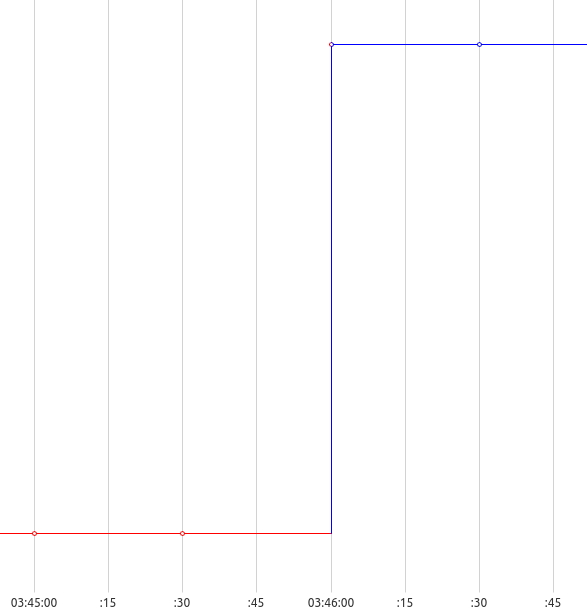
I've enabled value points to visualize the gap between them in the following screenshots. What's driving me crazy is the gradient on different zoom levels. Sometimes the area before timestamp "1562031960" (03:46:00) is colored blue and sometimes it's red. Is there any way to prevent this from happening? I only want y-values e.g. 4 to be colored blue.
What it should look like
What it does on different zoom levels
Size for users in frontend

Thank you for reading!
Contributor guide
No contributing guide indexed for this repository
First steps
- Read the whole issue, then the project's contributing guide.
- Comment on the issue to say you are picking it up — it saves two people doing the same work.
- Fork the repository and make your change on a branch.
- Open a pull request that references the issue number.
Research direction
Start with the demo's scaleGradient function and the shown stroke configuration; reproduce the red/blue stop behavior while zooming across timestamp 1562031960. Compare the rendered result with the expected rule that y-values such as 4 remain blue, and verify the behavior across zoom levels.
Written by the indexing model from the issue text.
Assessment
- Tech stack
- javascript
- Domain
- data-visualization
- Issue type
- Bug
- Difficulty
- 4/5
- Estimated time
- 3-5 days
- Activity status
- Stale
- Clarity
- Mostly clear
- Newbie friendliness
- 35/100