Custom Legend
Nobody has claimed this yet.
- Dominant language
- JavaScript
- Stars
- 10.5k
- Forks
- 463
- PR merge metrics
- No merged PRs in 30d
Description
Thanks for developing this amazing library!
I have the need for an interactive legend and would like to know if you have some ideas how I could customise the existing legend.
-
The legend needs to be on the left side for my use case, similar as this example:
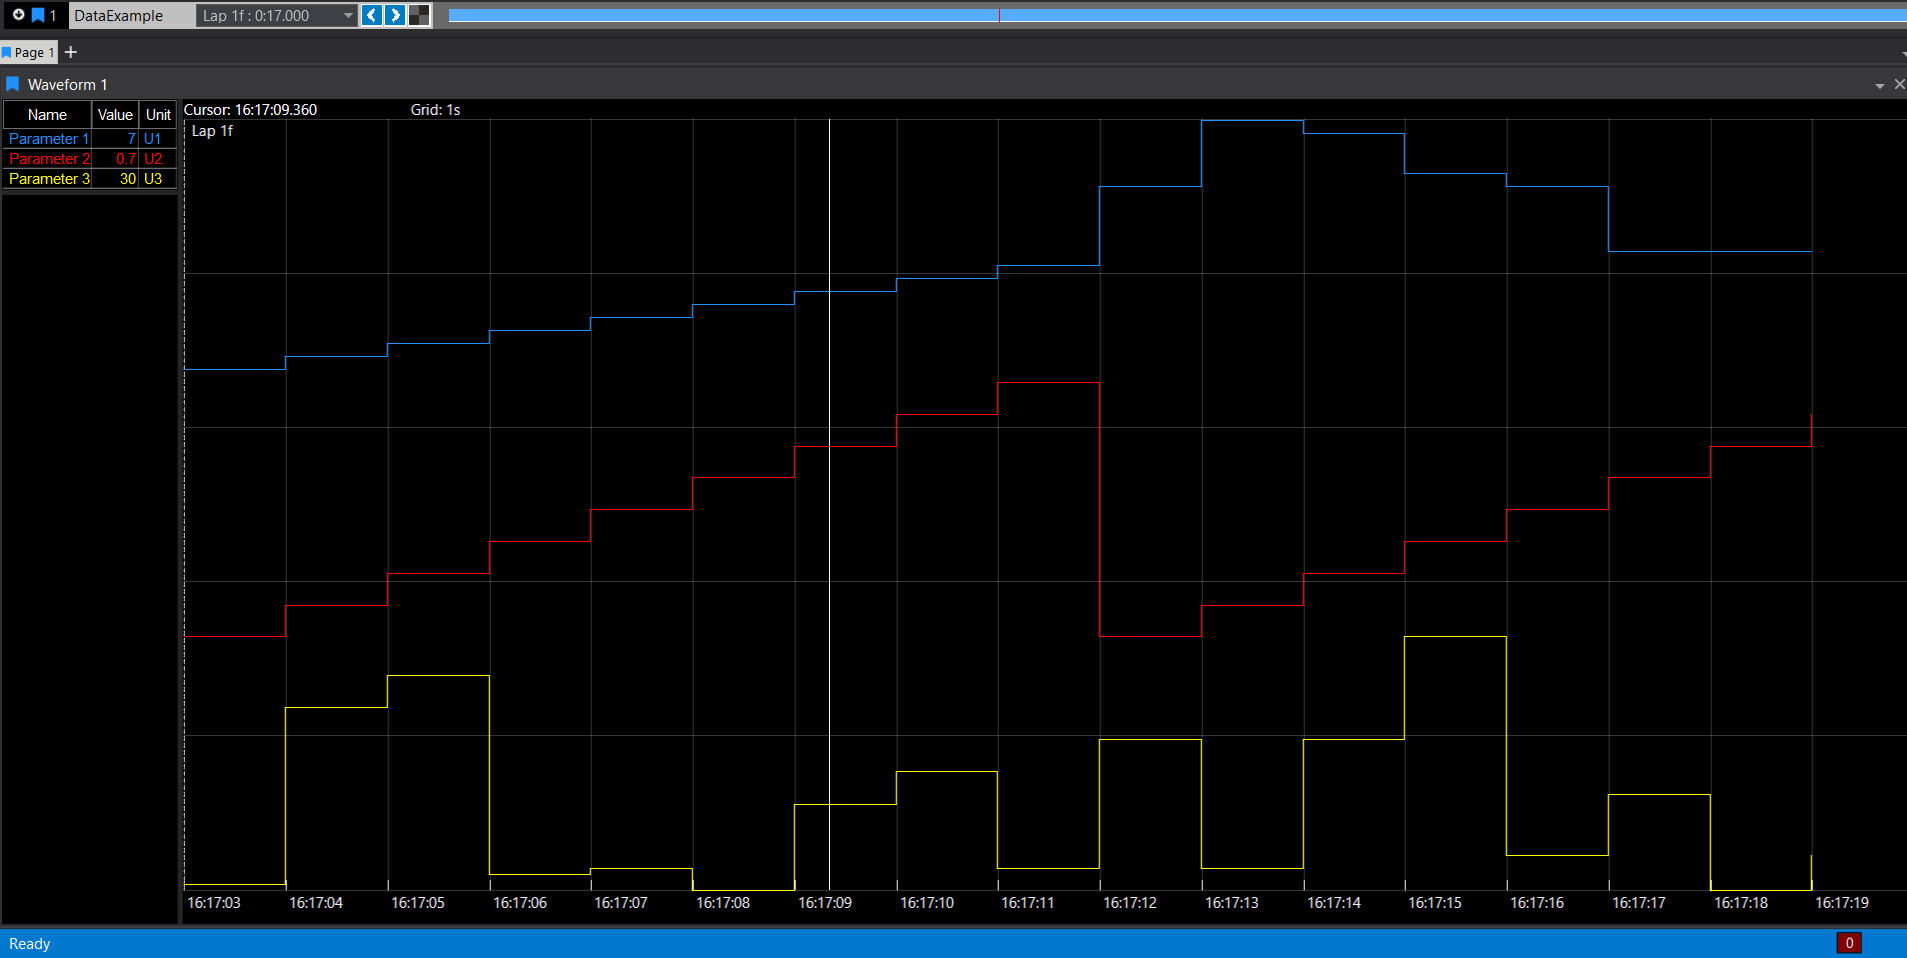
or another interesting option is to have the name of the signal overlayed in front of the axis ticks, as shown here:
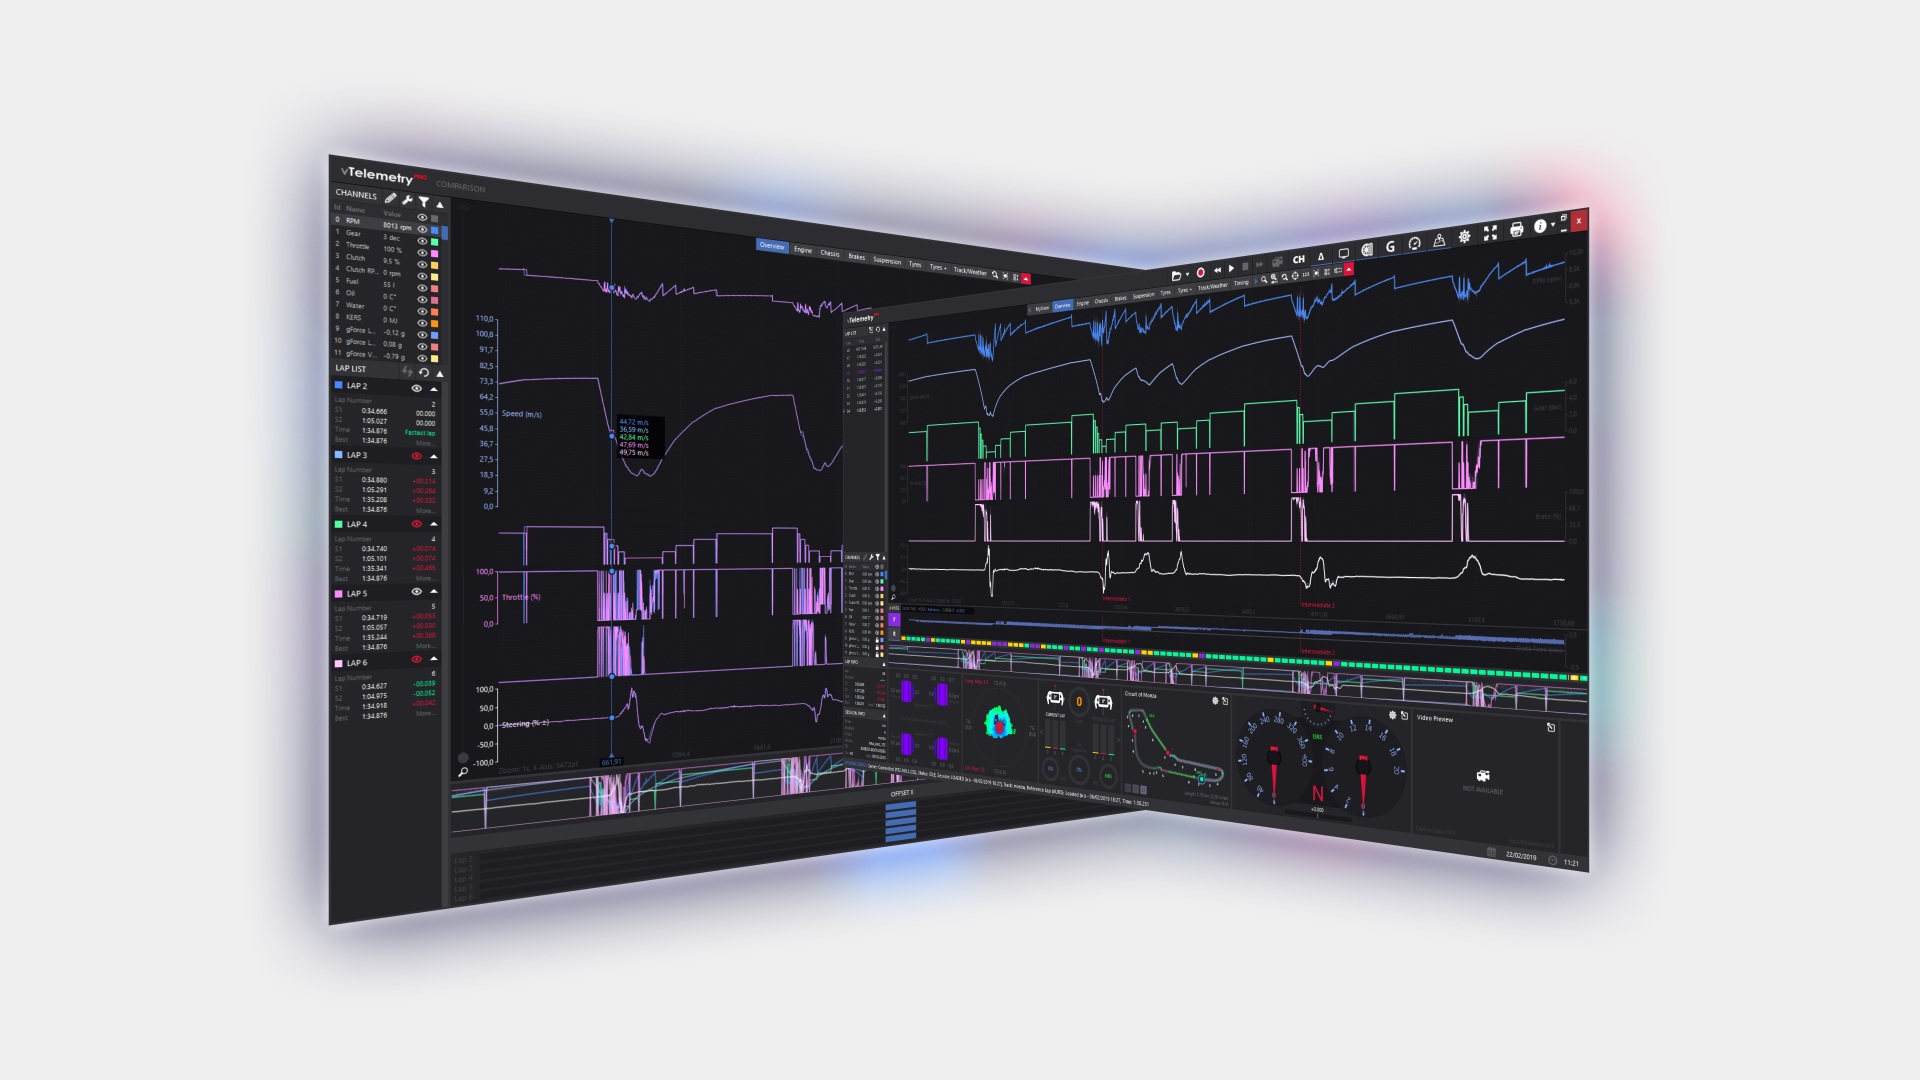
-
Additionally, I would need to display the min/max/avg values in the legend for the given interval
-
As I'm allowing the user to drag and drop signals dynamically onto the plot, I would need to be able to allow selected signals to be deleted, so either a signal label needs to have a delete button before/after or a common delete button should be available which can pick up the selected signal.
Do you have any suggestions how this could be realized? Thank you in advance!
Contributor guide
No contributing guide indexed for this repository
First steps
- Read the whole issue, then the project's contributing guide.
- Comment on the issue to say you are picking it up — it saves two people doing the same work.
- Fork the repository and make your change on a branch.
- Open a pull request that references the issue number.
Research direction
Review the existing legend and signal-selection behavior, then compare the requested left-side or overlaid legend layouts with the current plot presentation. A complete solution would define how interval min/max/avg values are shown and how a selected signal can be deleted; the issue names no files or tests to start from.
Written by the indexing model from the issue text.
Assessment
- Tech stack
- javascript
- Domain
- data-visualization, frontend
- Issue type
- Feature
- Difficulty
- 5/5
- Estimated time
- Over a week
- Activity status
- Stale
- Clarity
- Needs clarification
- Newbie friendliness
- 30/100