How to highlight/bold some points in y-axis?
Open
Nobody has claimed this yet.
enhancement
- Dominant language
- JavaScript
- Stars
- 10.5k
- Forks
- 463
- PR merge metrics
- No merged PRs in 30d
Description
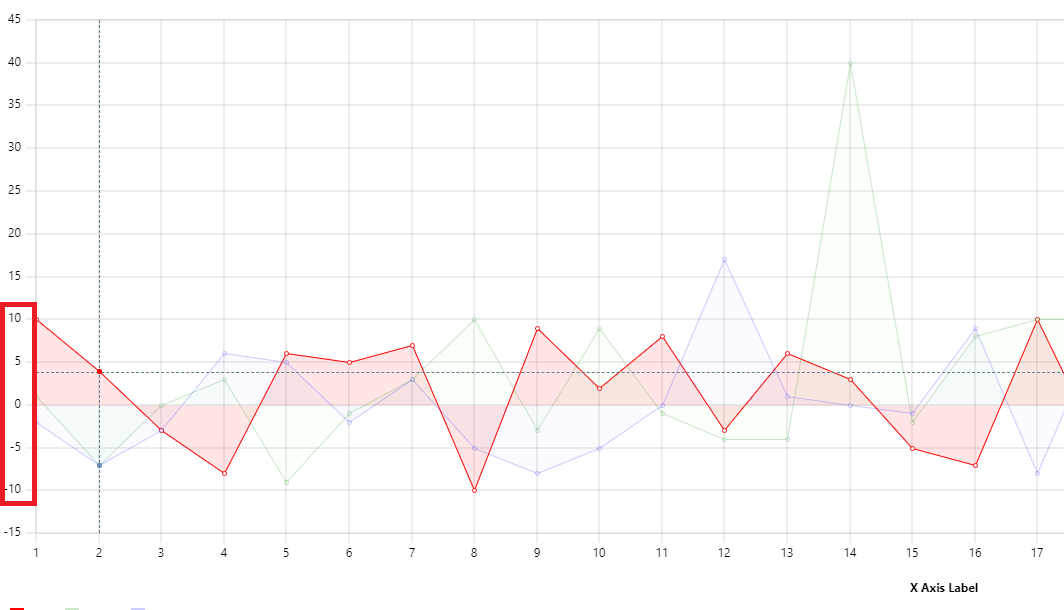
I want to customize the y-axis and make bold points on the y-axis based on min/max values of specific series when hover on the specific series.
want to highlight below-mentioned y-axis points :
Contributor guide
No contributing guide indexed for this repository
First steps
- Read the whole issue, then the project's contributing guide.
- Comment on the issue to say you are picking it up — it saves two people doing the same work.
- Fork the repository and make your change on a branch.
- Open a pull request that references the issue number.
Research direction
Start by reviewing the issue description and attached image to determine the intended y-axis highlighting behavior for hovered series and their min/max values. No source file, test, or entry point is named, so the relevant chart customization API and completion criteria would need to be established before implementation.
Written by the indexing model from the issue text.
Assessment
- Tech stack
- javascript
- Domain
- data-visualization
- Issue type
- Feature
- Difficulty
- 5/5
- Estimated time
- Over a week
- Activity status
- Stale
- Clarity
- Needs clarification
- Newbie friendliness
- 20/100