stacking demo of bars with lines improperly clips lines
Nobody has claimed this yet.
- Dominant language
- JavaScript
- Stars
- 10.5k
- Forks
- 463
- PR merge metrics
- No merged PRs in 30d
Description
Hi there!
First, thank you for the effort you've put into uPlot. It's a very impressive bit of kit.
The issue I'm running into pertains to drawing a chart with sets of series that use differing path types. I've experimented with the drawing order of each series and the data for each series, but I can't find a configuration that does not produce visual issues.
As a forewarning, I am using the stacked series plugin.
Example (using stacked series plugin):
const chartData = [[1553817600,1556578800,1559257200,1561676400,1572480000,1574985600,1577750400,1580428800,1582848000,1585609200,1588201200,1590706800,1593471600,1596150000,1598828400,1601420400],[68132,12102,23457,null,null,null,null,null,null,null,null,null,null,null,null,null],[31404,32061,36870,138926,29621,27995,25200,33596,36822,24411,34831,37553,38109,146347,79291,57954],[68132,12102,23457,null,null,null,null,null,null,null,null,null,null,null,null,null],[31404,32061,36870,138926,29621,27995,25200,33596,36822,24411,34831,37553,38109,146347,79291,57954]]
const chartOptions = {"width":773,"height":386.5,"series":[{},{"label":"Class A Shares","stroke":"#fc8764","spanGaps":true,"fill":"#fc8764","points":{"show":false}},{"label":"Class F Shares","stroke":"#ffb561","spanGaps":true,"fill":"#ffb561","points":{"show":false}},{"label":"Class L Shares","stroke":"#ff6b6b","spanGaps":true,"width":3},{"label":"Class Z Shares","stroke":"#7cd6fd","spanGaps":true,"width":3}],"axes":[{"space":70,"grid":{"show":false},"stroke":"#555b51","font":"12px inherit","gap":8},{"font":"12px inherit","stroke":"#555b51"}],"plugins":[{"hooks":{"setScale":[null],"setSeries":[null]}}],"scales":{"y":{}},"bands":[{"series":[2,1]},{"series":[3,2]},{"series":[4,3]}],"hooks":{"setSeries":[null]}}
This produces a graph that looks like this:
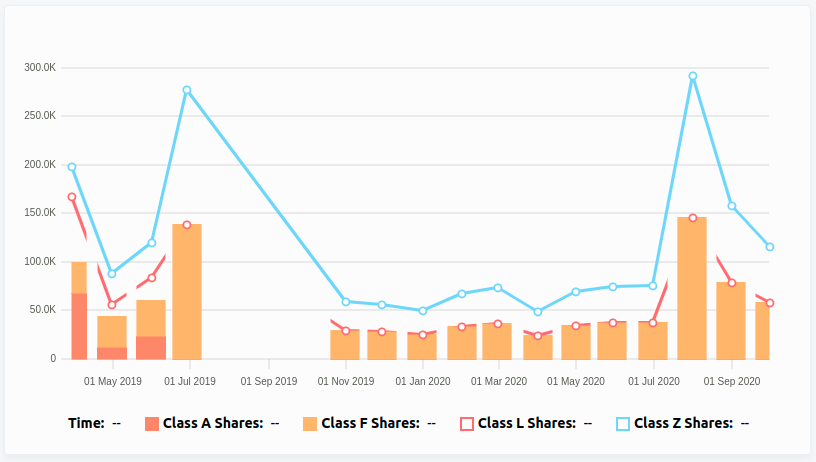
A few things I found interesting;
- The visual gap issue only occurs when there are one or more differing path styles
- The visual gap is only present on a line style series if it is preceded by a bar style series
- The issue only occurs when using the stacked series plugin.
Without stacked series plugin
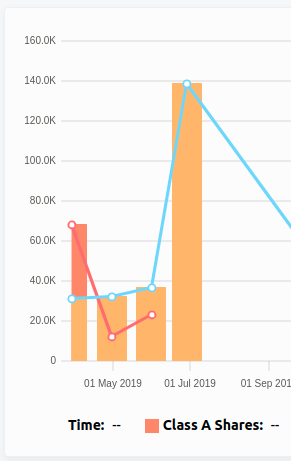
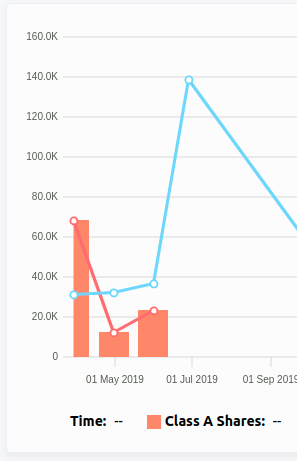
When I draw different sets without using the stacked plugin (which I prefer), I don't get the visual gap issue, but my bar type series' can occlude each other visually which is also a problem. Is there a way I can work around this?
See below for example;
| Class F toggled on: | Class F toggled off: |
|---|---|
 |
 |
Contributor guide
No contributing guide indexed for this repository
First steps
- Read the whole issue, then the project's contributing guide.
- Comment on the issue to say you are picking it up — it saves two people doing the same work.
- Fork the repository and make your change on a branch.
- Open a pull request that references the issue number.
Research direction
Reproduce the supplied chart configuration with the stacked series plugin, then inspect the plugin's handling of mixed bar and line path types and drawing order. Compare the stacked and non-stacked examples; done means stacked line series no longer show visual gaps and bar series do not improperly occlude one another.
Written by the indexing model from the issue text.
Assessment
- Tech stack
- javascript
- Domain
- data-visualization
- Issue type
- Bug
- Difficulty
- 4/5
- Estimated time
- 3-5 days
- Activity status
- Stale
- Clarity
- Mostly clear
- Newbie friendliness
- 38/100