Embed Korean fonts for graphs in Jupyter notebook
- Dominant language
- Python
- Stars
- 670
- Forks
- 183
- Avg merge
- 17h 7m
- Merged PRs (30d)
- 358
Description
### Main idea
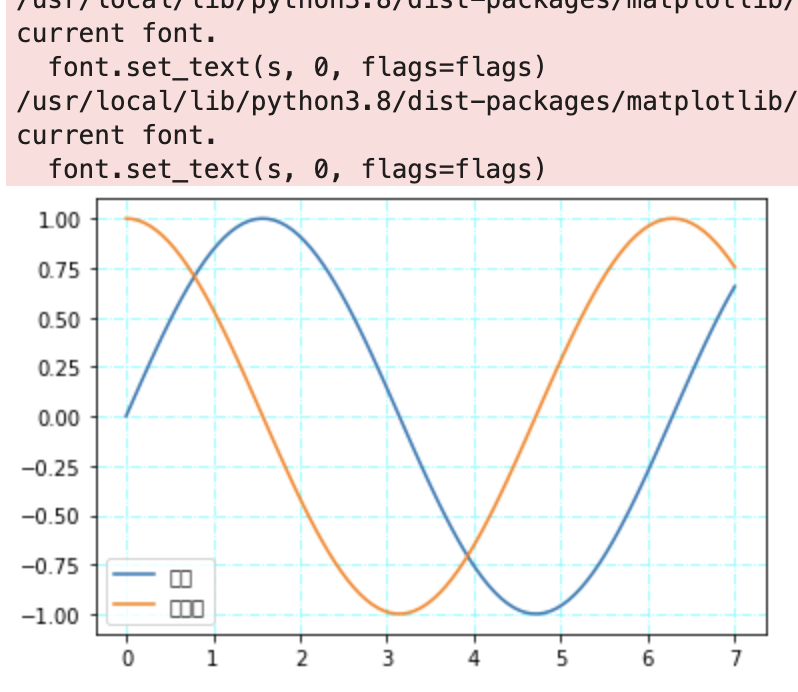
In Jupyter notebook, Korean characters are broken in plotted graphs. Steps to reproduce:
- Launch a compute session.
- Launch a Jupyter notebook app.
- Paste and execute the following code:
```python
import numpy as np
import matplotlib.pyplot as plt
x = np.linspace(0, 7, 100)
line1, = plt.plot(x, np.sin(x), label='싸인')
line2, = plt.plot(x, np.cos(x), label='코싸인')
plt.legend(handles=[line1, line2], loc='best')
plt.grid(b=True, color='aqua', alpha=0.6, linestyle='dashdot')
plt.show()
```
An example image:
### Alternative ideas
Would it be possible to embed Korean fonts to compute containers from Agent? It is possible to embed fonts in building kernel images, but we need to rebuild every image to support Korean characters in graphs.
### Anything else?
_No response_
Contributor guide
Assessment
This issue has not been assessed yet.