Expensive Views.render() allocations
- Dominant language
- Kotlin
- Stars
- 3k
- Forks
- 148
- Avg merge
- 13h 44m
- Merged PRs (30d)
- 1
Description
Hello! In shape-intensive applications, there's a visible memory allocation impact related to `Views.render()` calls.
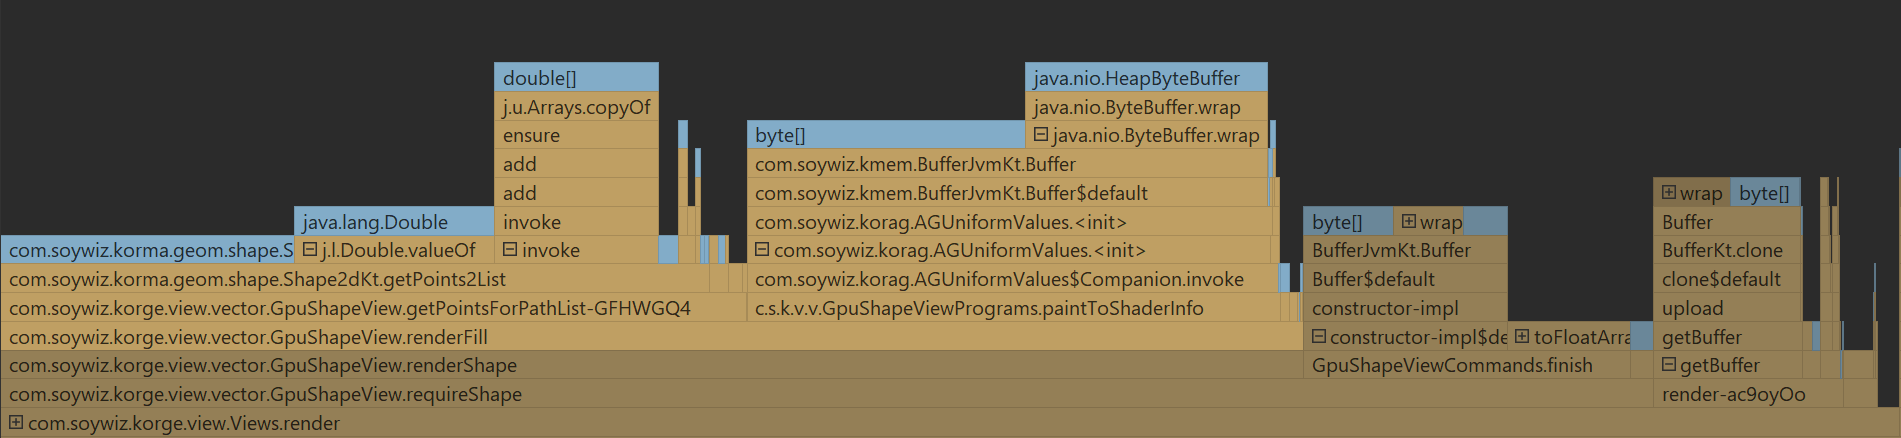
It seems like the first candidates for memory optimization/buffering/pooling would be:
- `getPoints2List`: some `Double` boxing still takes place? Expensive `PointArrayList` allocations.
- `GpuShapeViewPrograms.paintToShaderInfo(Matrix, Paint, double, double)`: Expensive `AGUniformValues` allocations (repeatedly created `private val data = Buffer(capacity)`)
- `GpuShapeViewCommands.finish()`: Repeatedly created `Float32Buffer` & underlying `Buffer`, `toFloatArray` copies.
Contributor guide
No contributing guide indexed for this repository
Research direction
Start by tracing Views.render() into getPoints2List, GpuShapeViewPrograms.paintToShaderInfo(Matrix, Paint, double, double), and GpuShapeViewCommands.finish(). Inspect the reported PointArrayList, AGUniformValues, Float32Buffer, Buffer, and toFloatArray allocations. Done means reducing the repeated allocations or copies identified in these paths, though the issue does not specify a target measurement or test.
Written by the indexing model from the issue text.
Assessment
- Tech stack
- kotlin
- Domain
- game-dev, performance
- Issue type
- Refactor
- Difficulty
- 4/5
- Estimated time
- 3-5 days
- Activity status
- Stale
- Clarity
- Needs clarification
- Newbie friendliness
- 35/100