Creating activity chart based on commits for personal/team git repos
Open
- Dominant language
- Go
- Stars
- 9.2k
- Forks
- 1.3k
- PR merge metrics
- PR metrics pending
Description
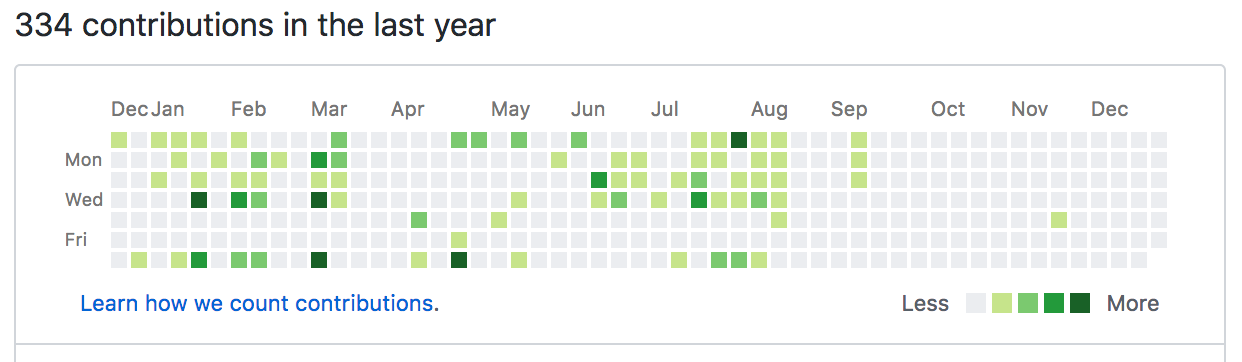
Well, it's not kind of those problems which prevent some features to do their job. but that would be something nice-to-have on profiles to show counts of commits per day per year.
This is the idea ( from Github itself ):
Contributor guide
No contributing guide indexed for this repository
Research direction
The issue names no files, tests, or entry points. Start by locating the profile implementation and the data source for personal and team git repositories; done would mean displaying commit counts per day across a year for those repositories.
Written by the indexing model from the issue text.
Assessment
- Tech stack
- git
- Domain
- data-visualization
- Issue type
- Feature
- Difficulty
- 5/5
- Estimated time
- Over a week
- Activity status
- Stale
- Clarity
- Needs clarification
- Newbie friendliness
- 25/100