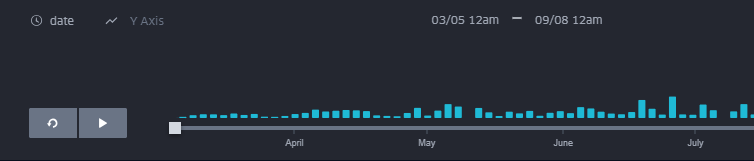
slider, add option to change from line serie to Bar chart
Open
backlog
- Dominant language
- TypeScript
- Stars
- 12k
- Forks
- 2k
- Avg merge
- 1d 5h
- Merged PRs (30d)
- 66
Description
I am using the time slider to show installed quantity per date, and it is perfect, some users want to see a bar chart instead of a line

the same format as this ( the default one)
Contributor guide
No contributing guide indexed for this repository
Assessment
This issue has not been assessed yet.