Edit height on hexbin to cumulative value.
- Dominant language
- TypeScript
- Stars
- 12k
- Forks
- 2k
- Avg merge
- 1d 5h
- Merged PRs (30d)
- 66
Description
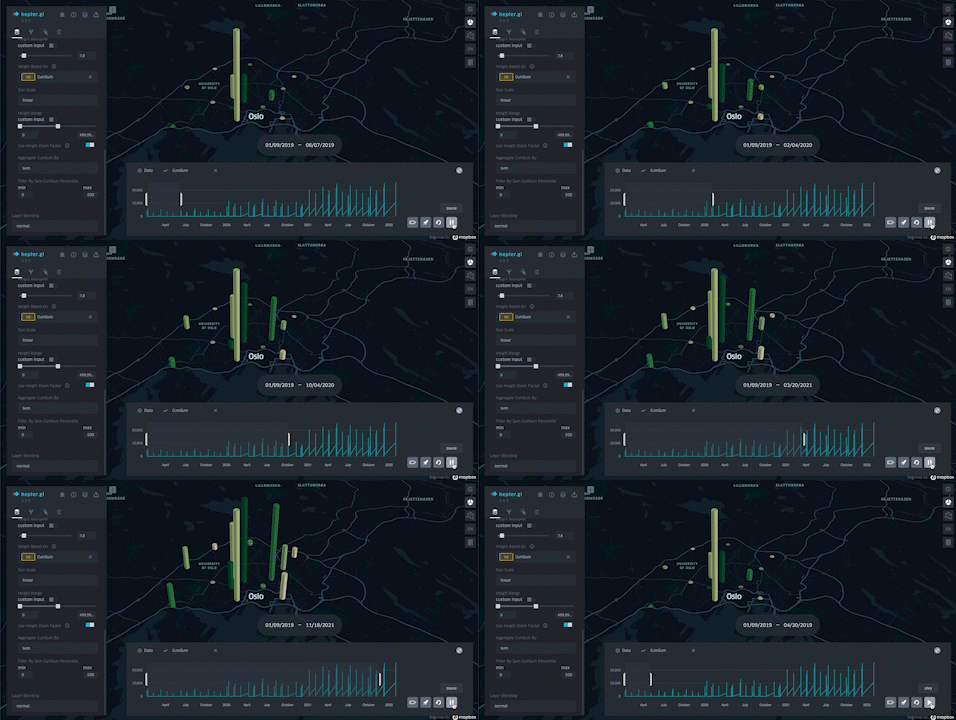
Hi! Brand new with Kepler.gl and I am trying to get som "bar-charts" (hexbin) to increase in height as the cumulative number of sales at that location increases.
I have put the datetime to the filter and the height is set to the sales, but the animation is pretty weird and i dont quite understand what is going on. For example, one of the stores´ bar-chart stays as the same height, and some of the others decrease in height, which should obviously not happen if it sums the sales cumulative. Also, 3 charts start with a large height, and they should really start at 0 and increase eventually.
Gif of animation:
Thanks!
Contributor guide
No contributing guide indexed for this repository
Research direction
Start with the hexbin layer's datetime filter and sales-based height animation, using the linked GIF to compare the reported behavior. Verify how values change across time for each store; the issue is resolved when every chart starts at zero and its height reflects cumulative sales without decreasing.
Written by the indexing model from the issue text.
Assessment
- Tech stack
- typescript
- Domain
- data-visualization
- Issue type
- Bug
- Difficulty
- 4/5
- Estimated time
- 3-5 days
- Activity status
- Stale
- Clarity
- Needs clarification
- Newbie friendliness
- 32/100