[Bug]
- Dominant language
- TypeScript
- Stars
- 12k
- Forks
- 2k
- Avg merge
- 1d 5h
- Merged PRs (30d)
- 66
Description
**Describe the bug**
A clear and concise description of what the bug is.
When doing the animation, it appears there is no option to fix the value range in the legend (i.e., the value range is dynamic in each time frame), which makes the data can't be compared in different time frames. For example, the following color legends have different value ranges at different times. Is there a potential way to solve this as a fixed value range in the animation?
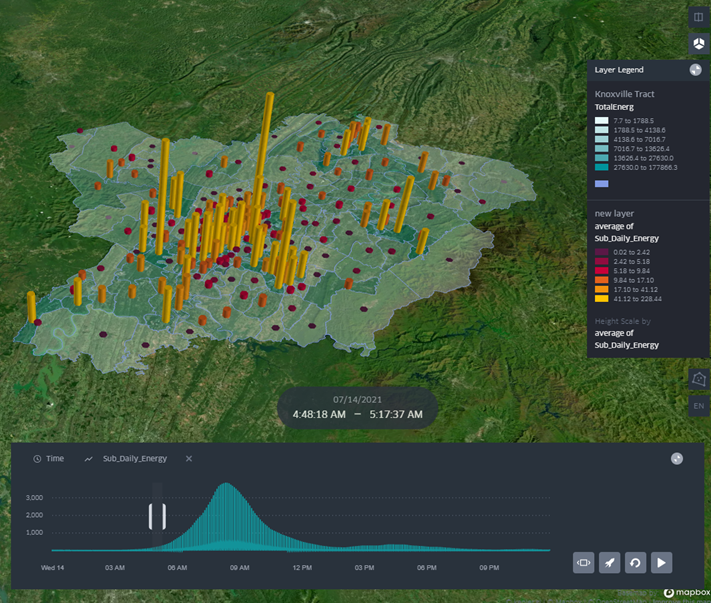
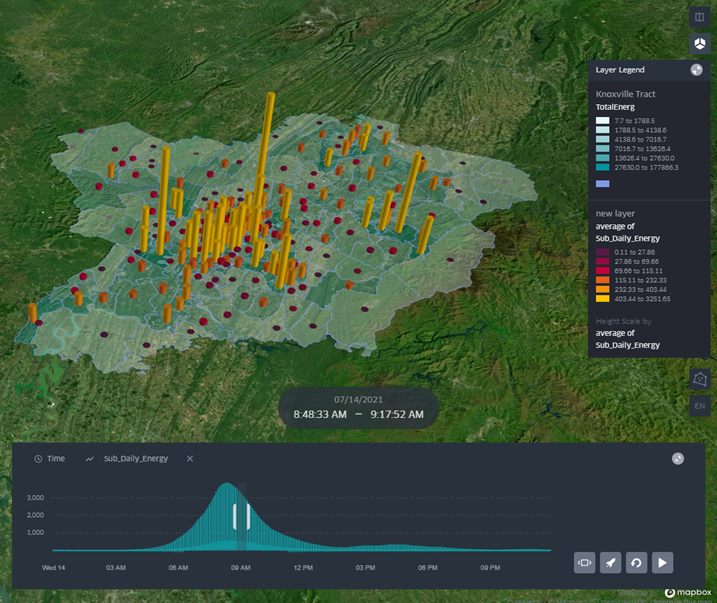
**Additional context**
The animation is produced online in Chrome (Windowns 10).
Contributor guide
No contributing guide indexed for this repository
Research direction
Reproduce the animation in Chrome using the behavior shown in the issue’s screenshots. Investigate how the color legend’s range changes between time frames, then verify that a fixed value range can be used so values remain comparable throughout the animation.
Written by the indexing model from the issue text.
Assessment
- Tech stack
- typescript
- Domain
- data-visualization, frontend
- Issue type
- Bug
- Difficulty
- 4/5
- Estimated time
- 3-5 days
- Activity status
- Stale
- Clarity
- Mostly clear
- Newbie friendliness
- 35/100