[Bug][Jupyter Widget]
- Dominant language
- TypeScript
- Stars
- 12k
- Forks
- 2k
- Avg merge
- 1d 5h
- Merged PRs (30d)
- 66
Description
**Describe the bug**
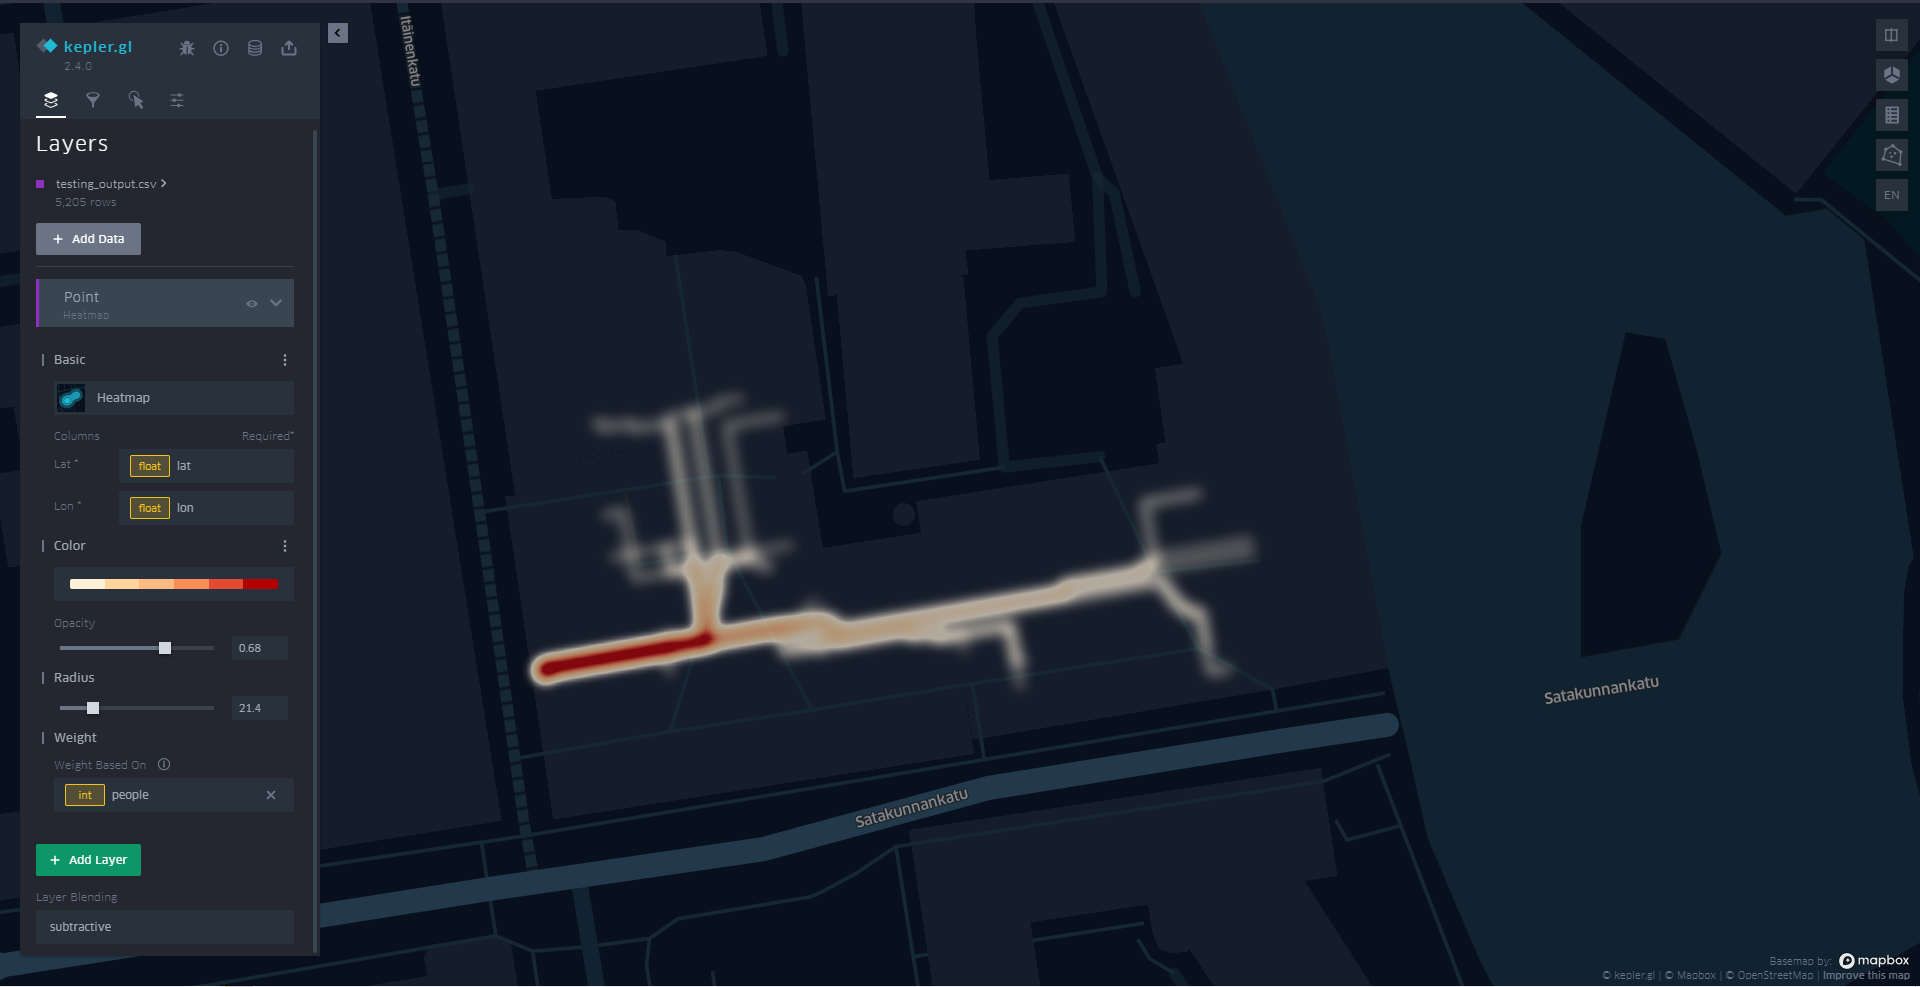
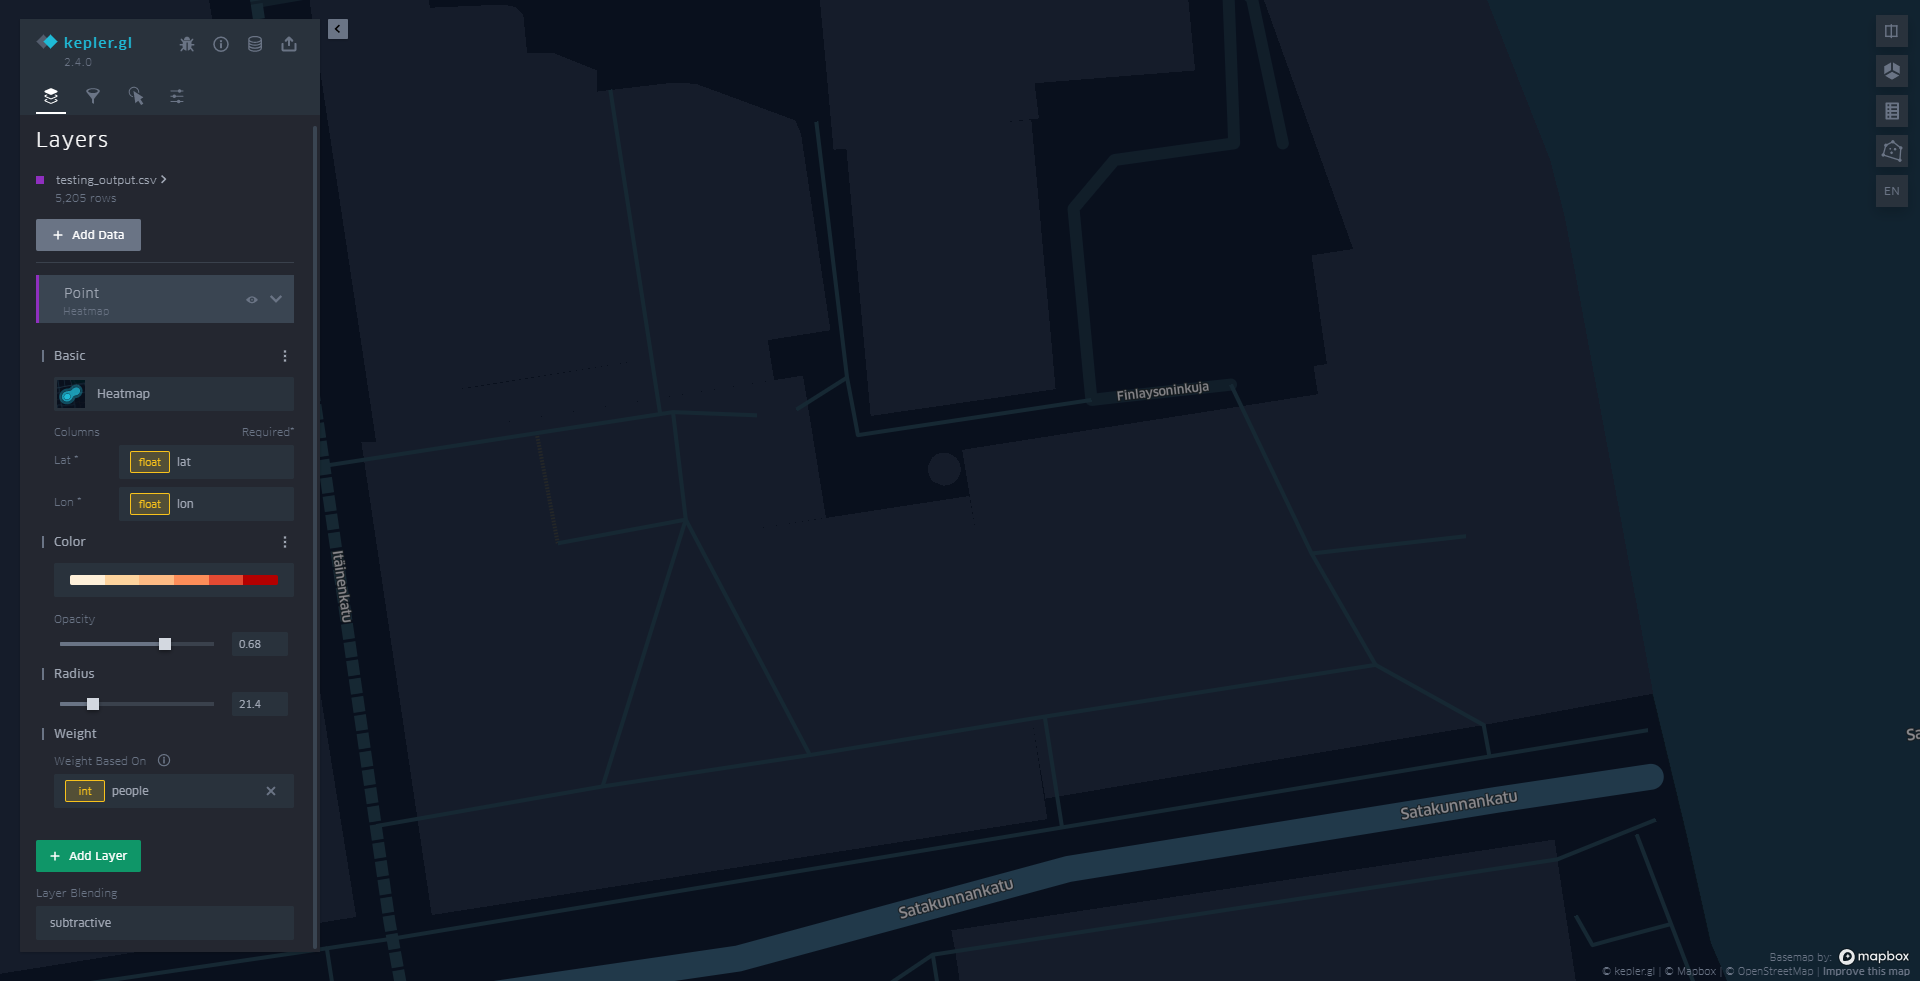
Heatmap option for points does not show up after zooming from a certain point.
**To Reproduce**
Data:
I am Grid points that a are 1 meter far from each other with CRS 4326
points have different values that I am using as the weighting of the heatmap.
Data is pandas format containing the lat and lon columns. There is also a column with a time stamp for filtering and animation.
Steps to reproduce the behavior:
Code for generating Kepler HTML:
```
from keplergl import KeplerGl
map= KeplerGl(height=800, data={"data": pandas_df.to_csv()})
map
```
2. Configuring data visualization:
1. changing the visualization to the heatmap
2. adjusting the radius to have a suitable heatmap.
3. Weight Based On weight column.
4. filtering the day column to get the data
3. Zooming in causes the heatmap to disappear
**Screenshots**
before zoom
After zoom
**Environment (please complete the following information):**
- Python version: Python 3.8.5
- keplergl Widget version 0.2.1
**Additional context**
My data is located in Tampere, Finland
Thank you for all your time and efforts!
Contributor guide
No contributing guide indexed for this repository
Assessment
This issue has not been assessed yet.