joshuaulrich / joshuaulrich/quantmod
Allow custom range for vertical axis in add* functions
- Dominant language
- R
- Stars
- 906
- Forks
- 233
- PR merge metrics
- No merged PRs in 30d
Description
### Description
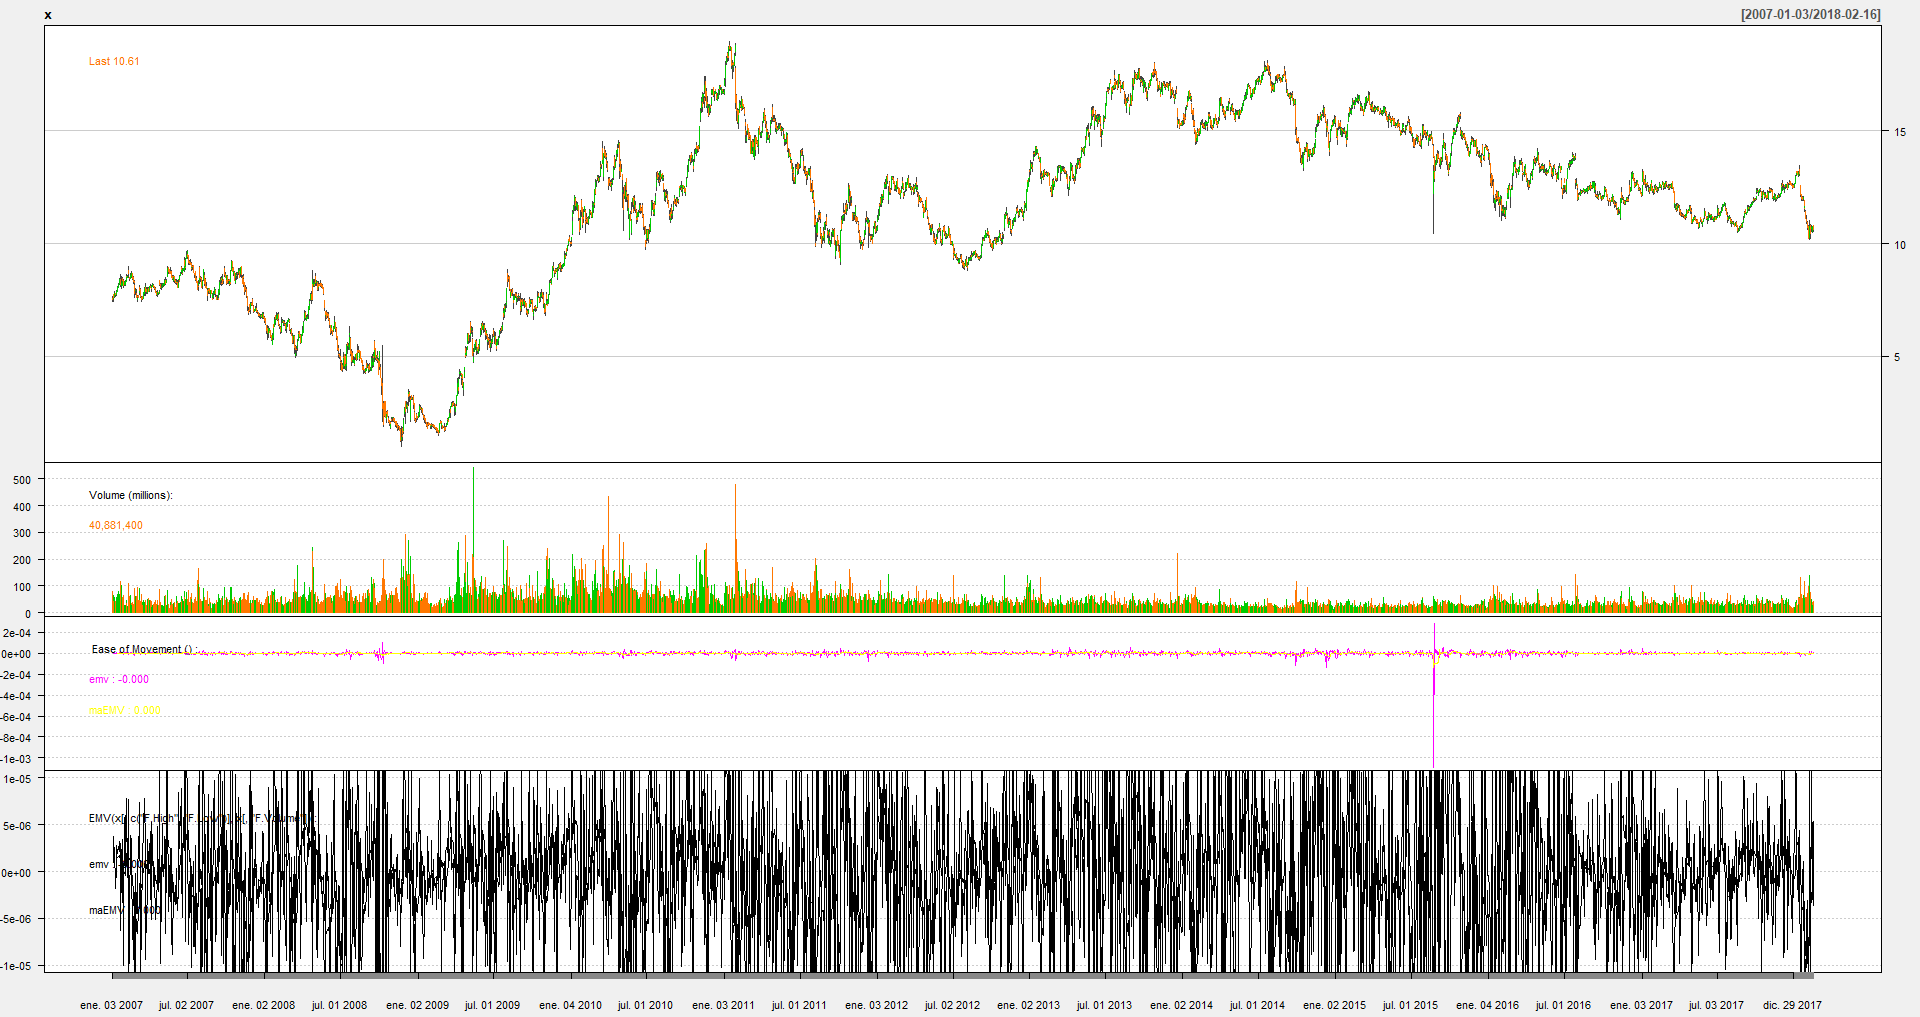
In the current implementation, add* functions do not allow the user to set a custom range for the vertical axis in the technical indicator plot. In other words, the user is tied to auto range when using functions such as `r addRSI`. In some cases, as shown in the MRE below, auto ranges can be inconvenient when there are extreme values in the sample. This limitation can be worked around using the `r addTA` function via the `r yrange` argument. Including such a feature in the add* functions is advisable.
### Expected behavior
Some add* functions [1] force auto range by setting `r yrange <- NULL` when creating the `r chobTA` object. An implementation of the request feature could include a new argument called `r yrange` defaulting to NULL that would be validated before passing to the `r chobTA` object. This small change should not have no side impacts in legacy code.
```r addEMV(yrange = c(-1E-5, 1E-5))```
[1] This includes addAroon, addCLV, addChAD, addEMV, addKST, addMFI, addOBV, addTDI, and addVolatility. addWPR uses a hard-coded range, possibly because the indicator is bounded. I did not study the functions that are expected to plot a line over an existing plot.
### Minimal, reproducible example
```r
library(quantmod)
x <- getSymbols('F', auto.assign = FALSE)
chartSeries(x, theme=chartTheme("white"))
# Plot EMV with auto yrange - extreme values make autorange inconvenient
addEMV()
# Plot EMV with given yrange (requested feature)
# addEMV(yrange = c(-1E-5, 1E-5))
# Plot EMV and work around addEMV overwriting the given yrange
addTA(
EMV(
x[, c("F.High", "F.Low")],
x[, "F.Volume"]
),
yrange = c(-1E-5, 1E-5)
)
```
### Session Info
```r
Session info -------------------------------------------------------------------------------------------------------------
setting value
version R version 3.4.1 (2017-06-30)
system x86_64, mingw32
ui RStudio (1.1.383)
language (EN)
collate Spanish_Argentina.1252
tz America/Buenos_Aires
date 2018-02-20
Packages -----------------------------------------------------------------------------------------------------------------
package * version date source
BH 1.65.0-1 2017-08-24 CRAN (R 3.4.1)
colorspace 1.3-2 2016-12-14 CRAN (R 3.4.1)
dichromat 2.0-0 2013-01-24 CRAN (R 3.4.1)
digest 0.6.12 2017-01-27 CRAN (R 3.4.1)
ggplot2 2.2.1 2016-12-30 CRAN (R 3.4.2)
graphics * 3.4.1 2017-06-30 local
grDevices * 3.4.1 2017-06-30 local
grid 3.4.1 2017-06-30 local
gridExtra 2.3 2017-09-09 CRAN (R 3.4.1)
gtable 0.2.0 2016-02-26 CRAN (R 3.4.1)
inline 0.3.14 2015-04-13 CRAN (R 3.4.1)
labeling 0.3 2014-08-23 CRAN (R 3.4.1)
lattice 0.20-35 2017-03-25 CRAN (R 3.4.1)
lazyeval 0.2.0 2016-06-12 CRAN (R 3.4.1)
magrittr 1.5 2014-11-22 CRAN (R 3.4.1)
MASS 7.3-47 2017-04-21 CRAN (R 3.4.2)
Matrix 1.2-10 2017-05-03 CRAN (R 3.4.1)
methods * 3.4.1 2017-06-30 local
munsell 0.4.3 2016-02-13 CRAN (R 3.4.1)
plyr 1.8.4 2016-06-08 CRAN (R 3.4.1)
R6 2.2.2 2017-06-17 CRAN (R 3.4.1)
RColorBrewer 1.1-2 2014-12-07 CRAN (R 3.4.1)
Rcpp 0.12.12 2017-07-15 CRAN (R 3.4.1)
RcppEigen 0.3.3.3.0 2017-05-01 CRAN (R 3.4.1)
reshape2 1.4.2 2016-10-22 CRAN (R 3.4.1)
rlang 0.1.2 2017-08-09 CRAN (R 3.4.1)
rstan 2.16.2 2017-07-03 CRAN (R 3.4.1)
scales 0.5.0 2017-08-24 CRAN (R 3.4.1)
StanHeaders 2.16.0-1 2017-07-03 CRAN (R 3.4.1)
stats * 3.4.1 2017-06-30 local
stats4 3.4.1 2017-06-30 local
stringi 1.1.5 2017-04-07 CRAN (R 3.4.1)
stringr 1.2.0 2017-02-18 CRAN (R 3.4.1)
tibble 1.3.4 2017-08-22 CRAN (R 3.4.1)
tools 3.4.1 2017-06-30 local
utils * 3.4.1 2017-06-30 local
viridisLite 0.2.0 2017-03-24 CRAN (R 3.4.1)
```
Contributor guide
No contributing guide indexed for this repository
Research direction
Start by locating addAroon, addCLV, addChAD, addEMV, addKST, addMFI, addOBV, addTDI, and addVolatility, then inspect how each creates the chobTA object and sets yrange. Use the supplied addEMV example to check the current behavior. Done means the listed functions accept a validated yrange argument while preserving default behavior when it is NULL.
Written by the indexing model from the issue text.
Assessment
- Tech stack
- r
- Domain
- data-visualization
- Issue type
- Feature
- Difficulty
- 3/5
- Estimated time
- 1-2 days
- Activity status
- Stale
- Clarity
- Mostly clear
- Newbie friendliness
- 48/100