Request to add custom fields visualization in standalone viewer for point clouds
- Dominant language
- C++
- Stars
- 14k
- Forks
- 2.6k
- Avg merge
- 5d 18h
- Merged PRs (30d)
- 6
Description
### Checklist
- [X] I have searched for [similar issues](https://github.com/isl-org/Open3D/issues).
- [X] For Python issues, I have tested with the [latest development wheel](http://www.open3d.org/docs/latest/getting_started.html#development-version-pip).
- [X] I have checked the [release documentation](http://www.open3d.org/docs/release/) and the [latest documentation](http://www.open3d.org/docs/latest/) (for `master` branch).
### Proposed new feature or change
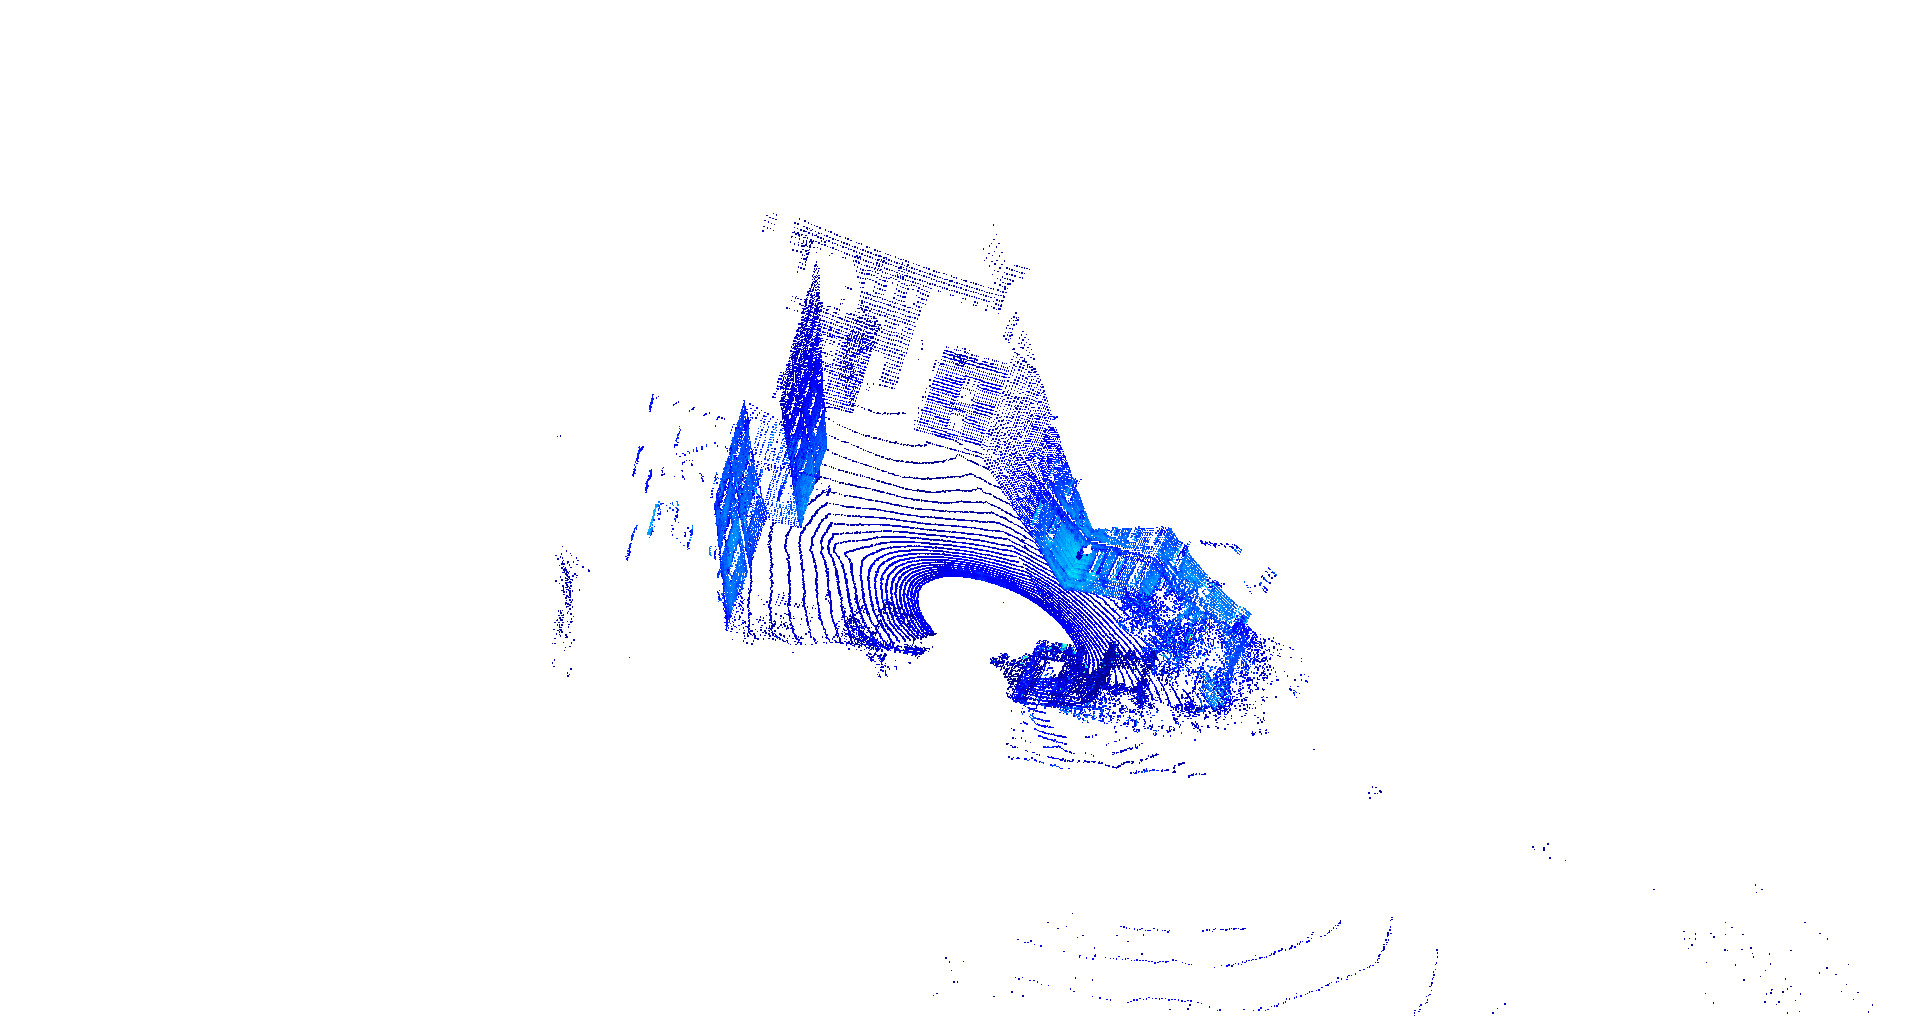
In the standalone viewer (the one invoked with `open3d draw some_pointcloud.pcd`), it would be nice to have the option to color the points based on the custom fields the point cloud may have (e.g. the intensity).
### References
This is a basic implementation I did in python:
```
source_attribute = source_temp.point["intensity"].numpy().flatten()
max_tot = max(source_attribute)
source_attribute = source_attribute / max_tot
colors_map = cm.get_cmap('jet', 256)
source_colors = colors_map(source_attribute)
source_temp_legacy.colors = o3d.utility.Vector3dVector(source_colors[:, :3])
```
### Additional information
_No response_
Contributor guide
No contributing guide indexed for this repository
Assessment
This issue has not been assessed yet.