Sample code gives different visualization result
- Dominant language
- C++
- Stars
- 14k
- Forks
- 2.6k
- Avg merge
- 5d 18h
- Merged PRs (30d)
- 6
Description
So if I run the code below like a simple script: `python3 map_viewer.py` it produces a nice map.
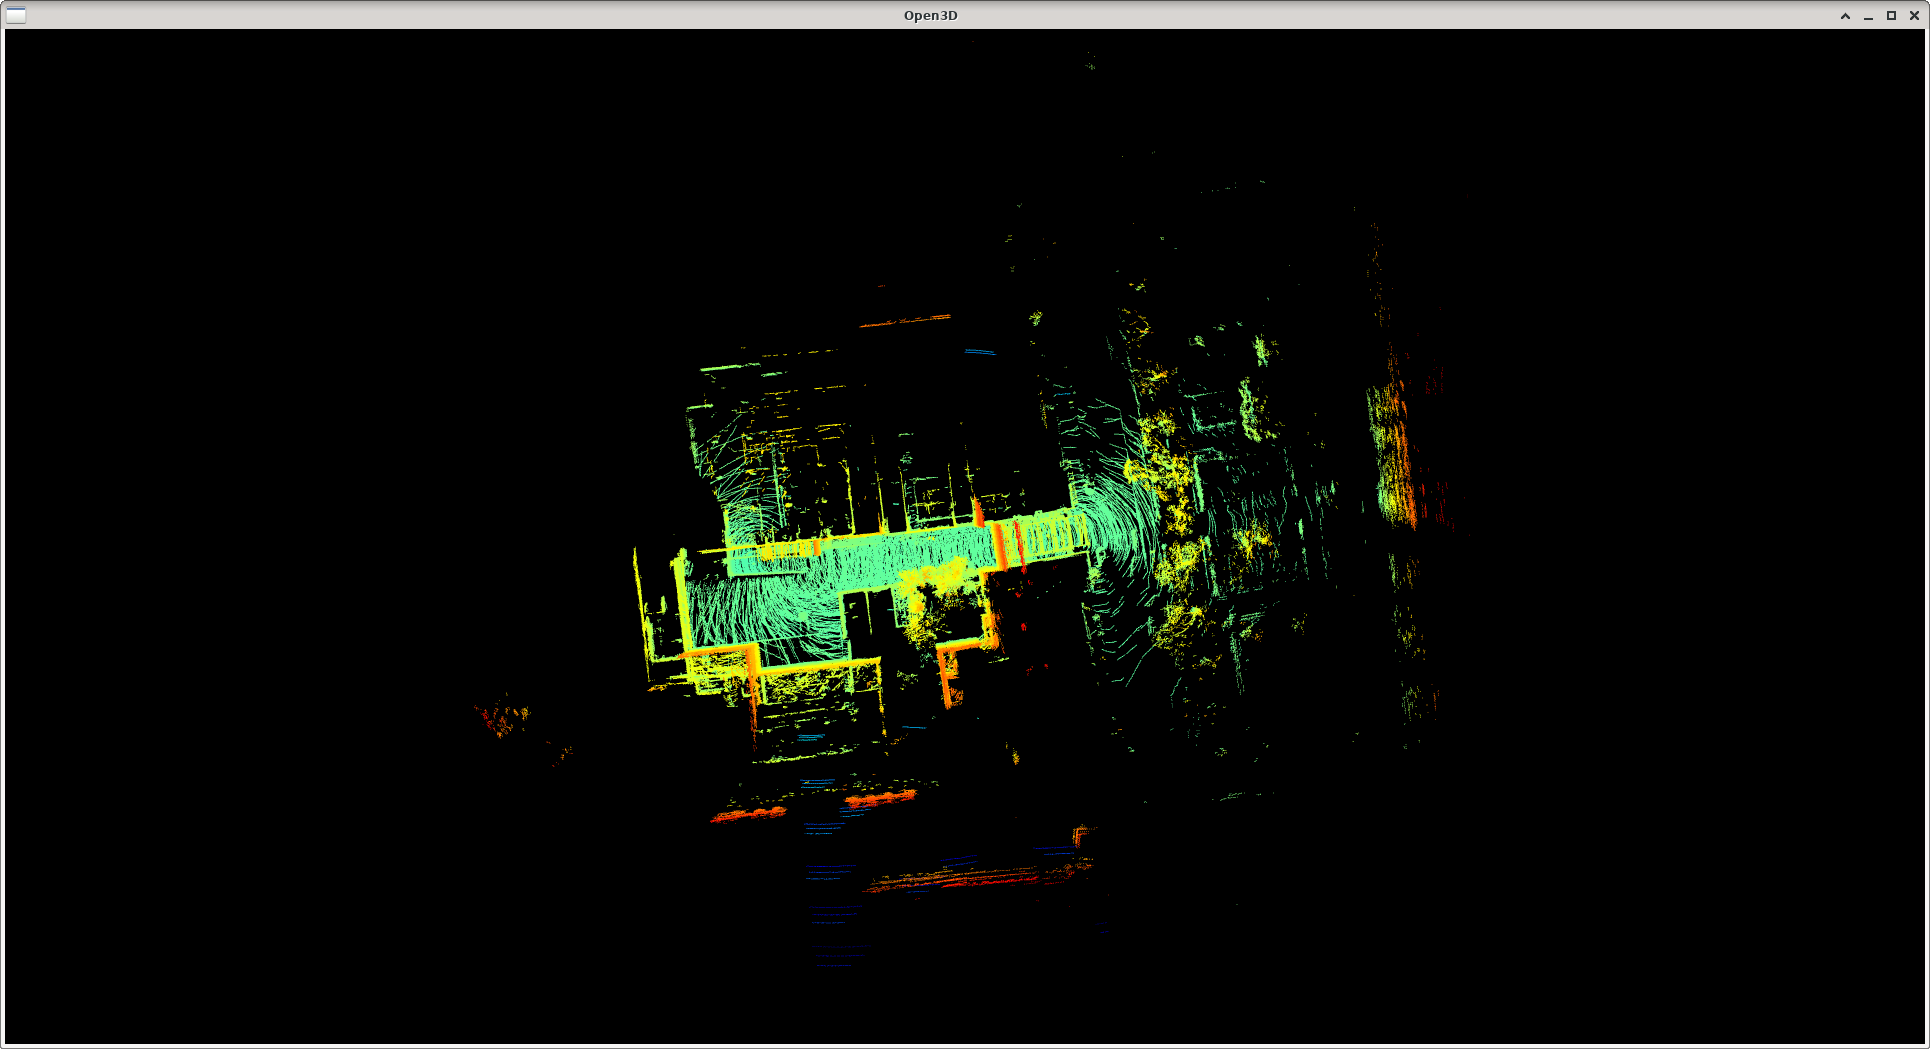
But if the same code I run from my app, where I trigger `MapViewer().show()` on button click I get this:
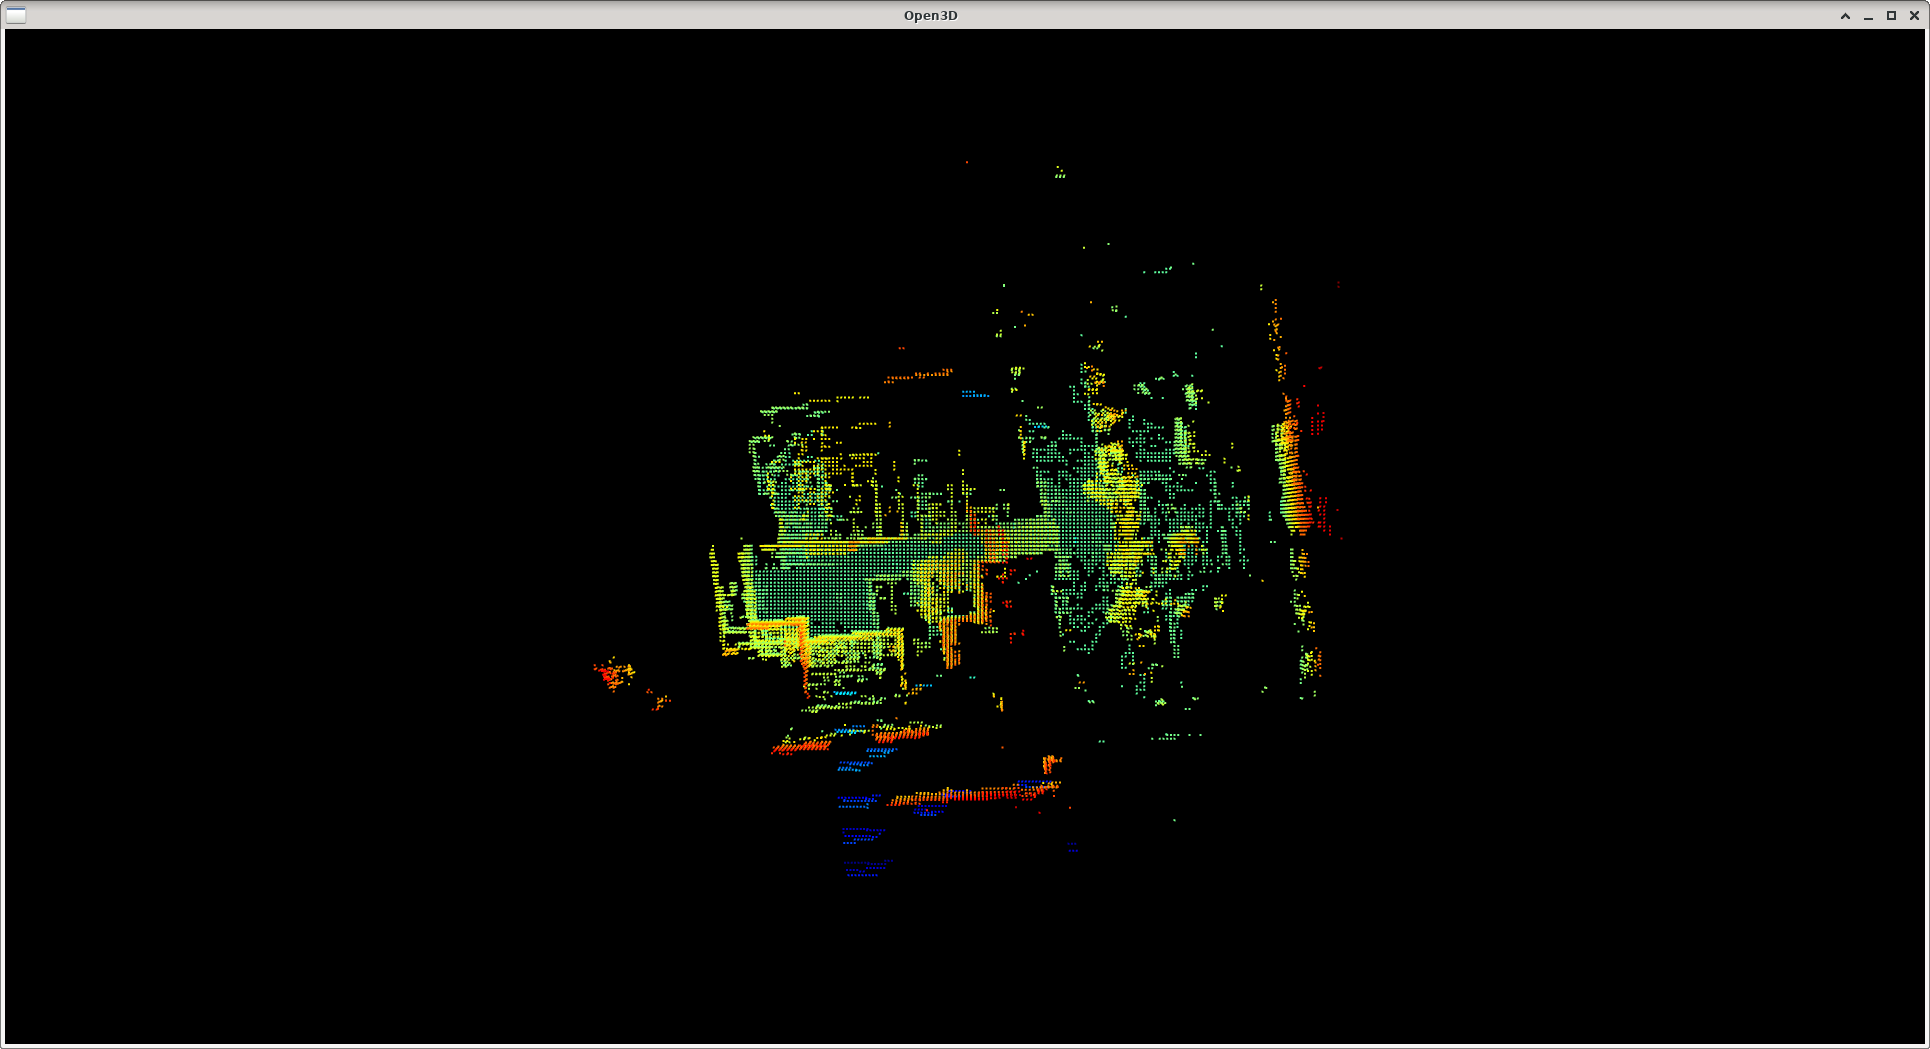
Points here are aligned along grid.
```python
import numpy as np
import open3d as o3d
class MapViewer:
def __init__(self):
super().__init__()
self.pcd = None
self.vis = o3d.visualization.Visualizer()
def load_point_cloud(self, filepath="/home/stsdc/test.pcd"):
self.pcd = o3d.io.read_point_cloud(filepath)
def show(self):
self.load_point_cloud()
if self.pcd:
self.vis.create_window()
render_option = self.vis.get_render_option()
render_option.point_size = 0.7
render_option.background_color = (0, 0, 0)
self.vis.add_geometry(self.pcd)
self.vis.run()
self.vis.destroy_window()
else:
self.vis.destroy_window()
MapViewer().show()
```
Please help, I feel dumb :roll_eyes: .
Contributor guide
No contributing guide indexed for this repository
Assessment
This issue has not been assessed yet.