Jupyter visualization doesn't plot figures on Ubuntu18.04 and Ubuntu16.04 server
- Dominant language
- C++
- Stars
- 14k
- Forks
- 2.6k
- Avg merge
- 5d 18h
- Merged PRs (30d)
- 6
Description
**IMPORTANT: Please use the following template to report the bug.**
_____
**Describe the bug**
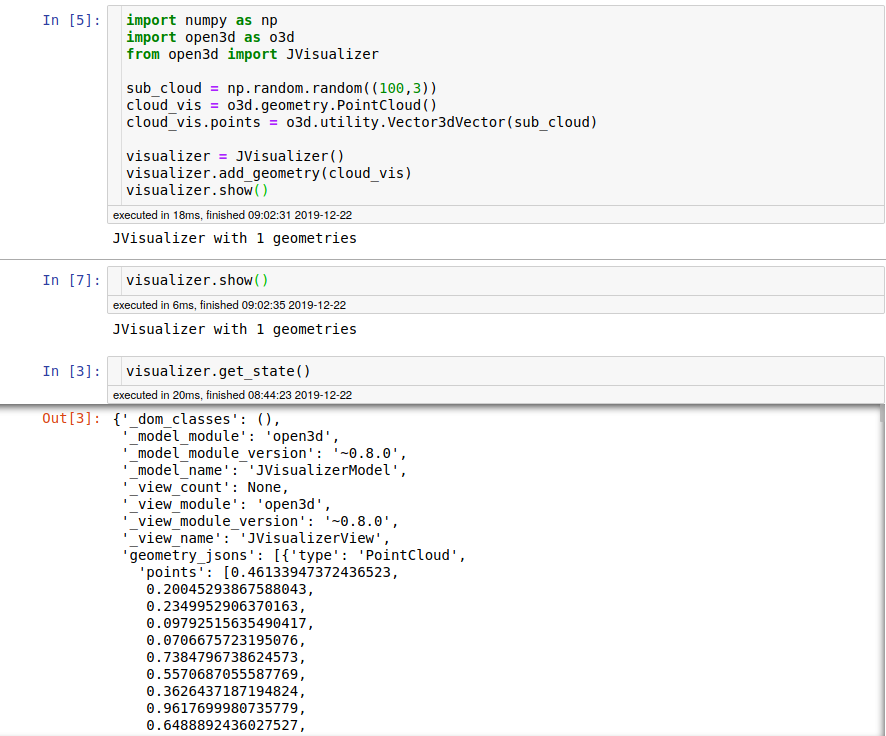
Jupyter visualization doesn't draw figures on Ubuntu18.04 and Ubuntu16.04 server. When I ran the following code, it didn't report any errors, but also plotted no figures. I tested on Ubuntu18.04 and Ubuntu16.04 server with open3d 0.7, 0.8 and 0.9, same problems. But it works well on my Macbook.
`
import numpy as np
import open3d as o3d
from open3d import JVisualizer
sub_cloud = np.random.random((100,3))
cloud_vis = o3d.geometry.PointCloud()
cloud_vis.points = o3d.utility.Vector3dVector(sub_cloud)
visualizer = JVisualizer()
visualizer.add_geometry(cloud_vis)
visualizer.show()
`
**Expected behavior**
I want find some ways to fix this problem, so I can work with Jupyter visualization on ubuntu systems.
**Screenshots**
**Environment (please complete the following information):**
I have tried it on Ubuntu systems with different python versions, open3d versions and installing methods, and met same problem:
- OS: Ubuntu 16.04 server , Ubuntu 18.04
- Python version: 3.5, 3.6
- Open3D version: 0.7, 0.8, 0.9
- Is this remote workstation?: yes, no
- How did you install Open3D?: pip and build_from_source ( GCC, CMake)
Contributor guide
No contributing guide indexed for this repository
Assessment
This issue has not been assessed yet.