PyPerf native stacks performance improvements
- Dominant language
- Python
- Stars
- 826
- Forks
- 79
- PR merge metrics
- No merged PRs in 30d
Description
PyPerf native stacks symbolication is very heavy. On a system with high Python load, PyPerf can get to 100% CPU utilization on the thread that performs the symbolication, and it ends up not being able to complete it in time; then by the time gProfiler signals PyPerf to dump its outputs, PyPerf is too lagged behind and we don't get the data.
It's logic under `get_proc_name`.
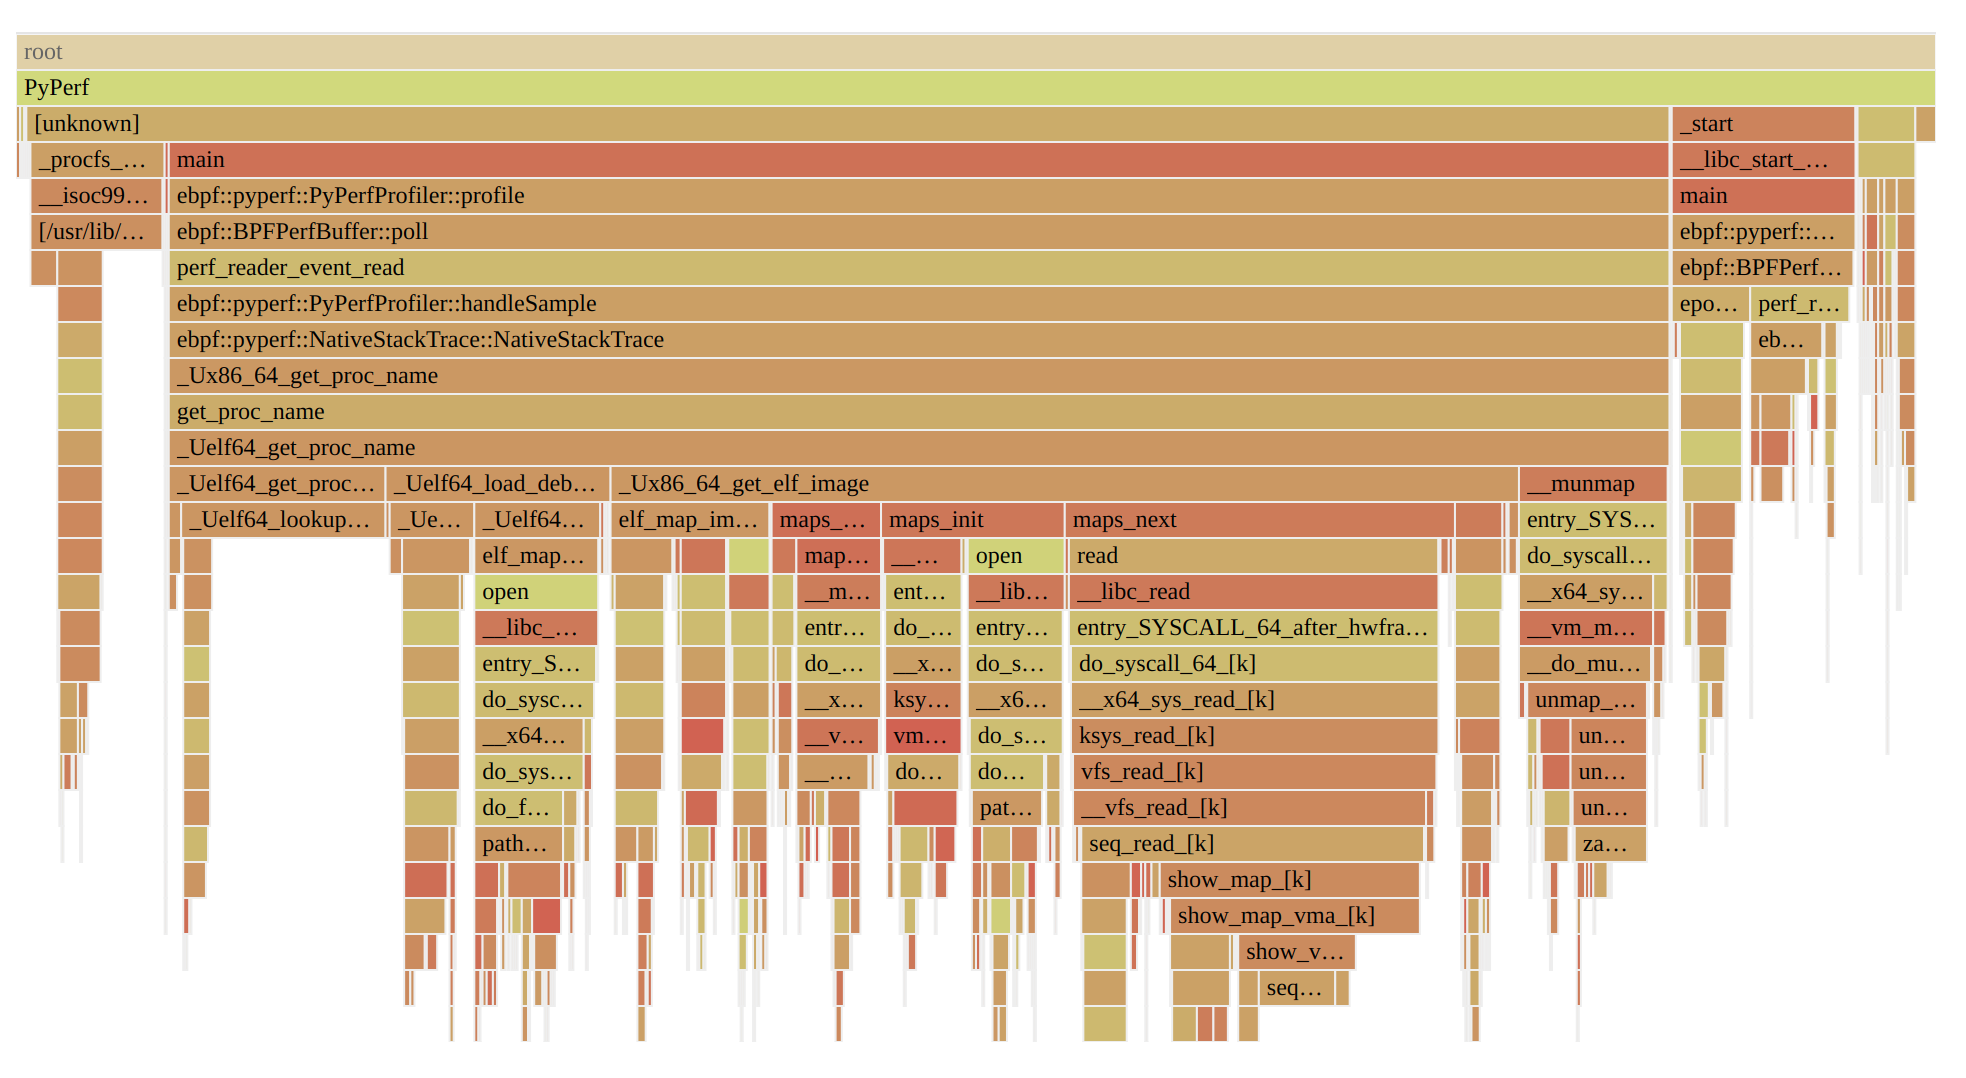
To reproduce this, you can run multiple Python processes doing `while 1: pass` and run gProfiler in higher frequency (e.g `-f 99`). Also use DWARF mode for `perf` (`--perf-mode dwarf`) to get proper stacks for PyPerf. I assume the solution will be caching at some level.
Contributor guide
Assessment
This issue has not been assessed yet.