insightsengineering / insightsengineering/goshawk
hline/vline legend labels
- Dominant language
- R
- Stars
- 5
- Forks
- 1
- PR merge metrics
- No merged PRs in 30d
Description
in boxplot, as in other modules that handle one assay at a time, the range lines legend labels displays variable label.
in correlation plot where it handles two assays and thus the data requires pivoting, the legend only displays variable name.
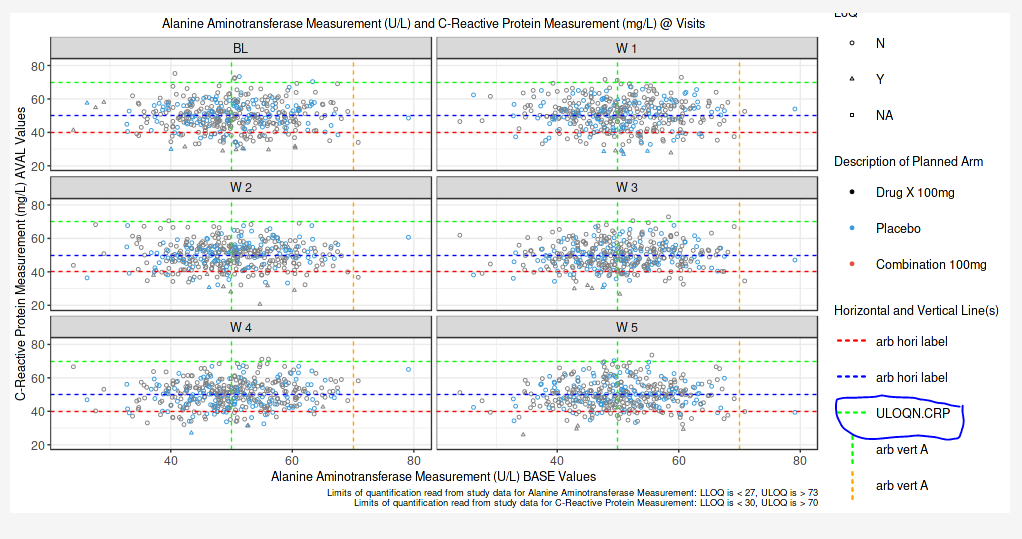
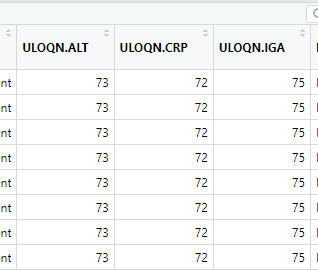
the pivoted table columns do not have label attribute set.
consider the following
perhaps something like if LLOQ then
paste("Lower Limit of Quantitation:", xaxis_param)
paste("Lower Limit of Quantitation:", yaxis_param)
or if ULOQ
paste("Upper Limit of Quantitation:", , xaxis_param)
paste("Upper Limit of Quantitation:", , yaxis_param)
or
.would it be possible to label the LLOQ* and ULOQ* variables in the plot_data_2 table generically as "Lower Limit of Quantitation" and "Upper Limit of Quantitation" respectively and then since we have the PARAMCD value for the selected x-axis and y-axis to concatenate the two to create the legend label?
paste0(attributes(plot_data_t2$ARM)$label, ": ", xaxis_param)
etc.
Contributor guide
Assessment
This issue has not been assessed yet.